Combining Footprint and Volume Profile
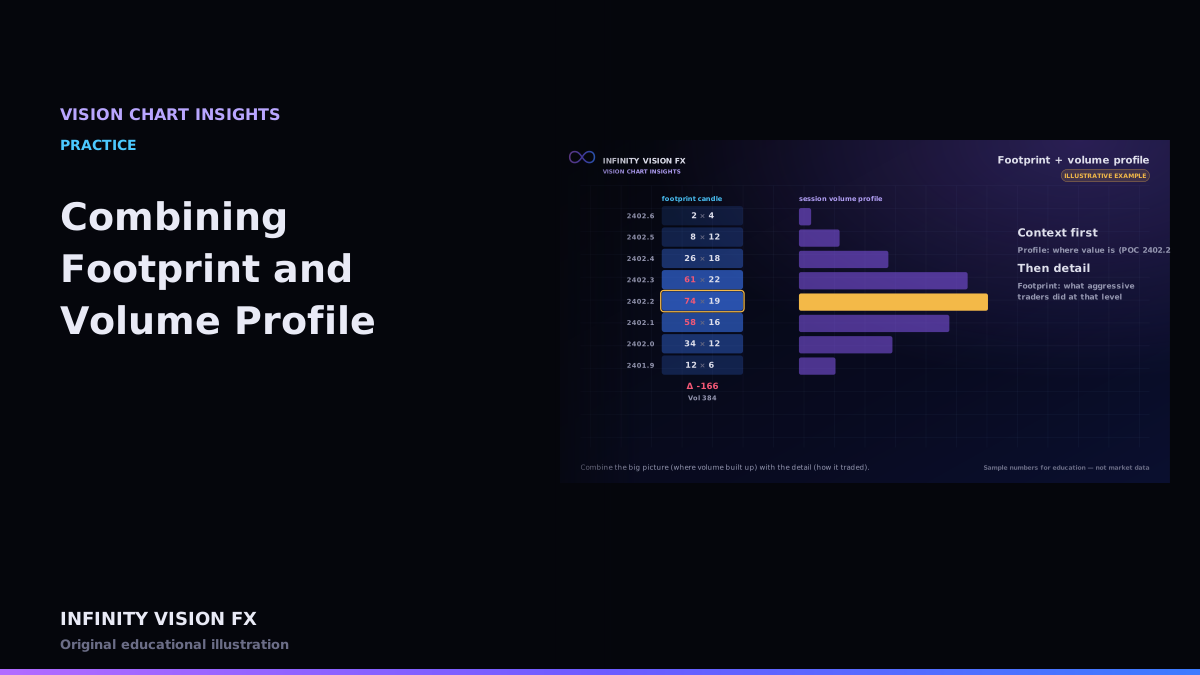
Volume profile and footprint answer different questions. Used together, they give context and detail.
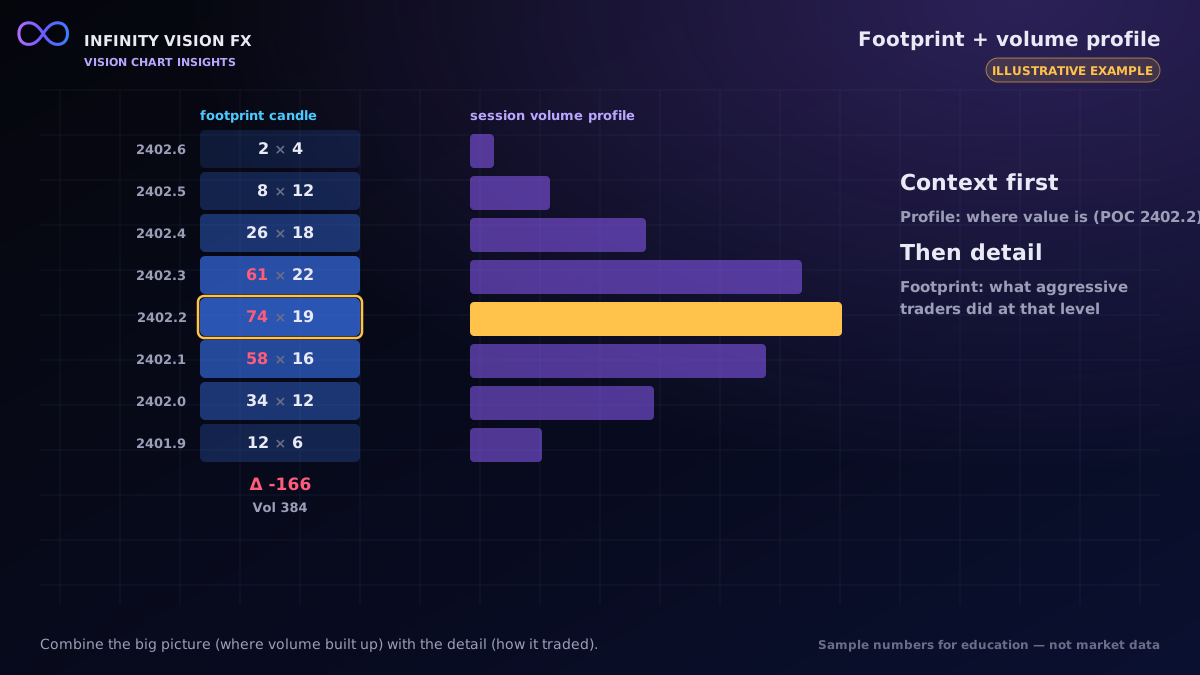
Step 1 — context from the profile
Mark the session (or composite) POC, VAH and VAL, plus obvious high- and low-volume nodes. These are the areas where the market previously accepted or rejected prices.
Step 2 — detail from the footprint
When price reaches one of those areas, look at the footprint candles there:
- Is there heavy aggression with no progress (potential absorption)?
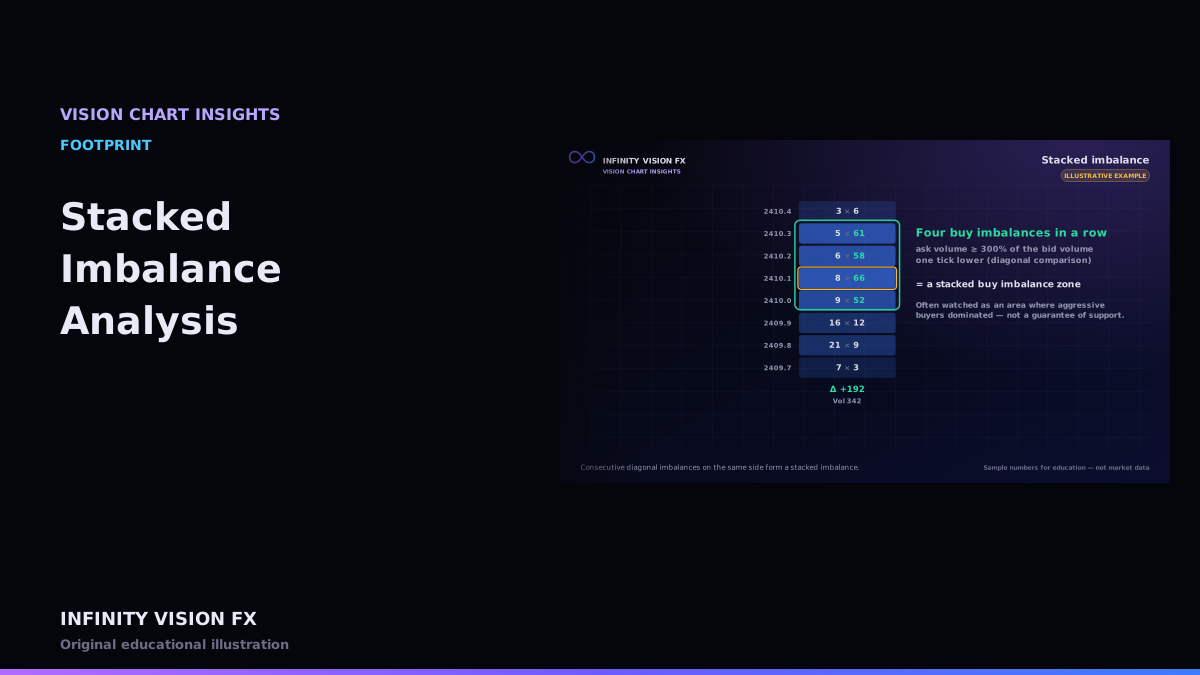
- Are there stacked imbalances showing one side taking control?
- Does delta agree with the move?
Step 3 — confirm with the book and the tape
If depth data is available, check whether liquidity at the level was refreshed or pulled, and whether tape speed changed.
An illustrative sequence
Price drops into the prior session's VAL. Footprint shows 400 contracts of selling at two prices with a 3-tick range; the DOM bid is refreshed several times; tape speed spikes then fades. Together these describe potential absorption at a known reference level. What happens next is still unknown — the analysis describes the present, not the future.
A checklist you can reuse
- Where am I? Inside value, at VAH/VAL, or outside value?
- What is the context? Higher-timeframe trend, session, upcoming news.
- What does aggression do here? Delta, imbalances, stacked imbalances.
- Is anyone passive here? Absorption, refreshed size, icebergs.
- Is activity changing? Tape speed, big prints.
- What would prove my reading wrong? A price level or behaviour, written down in advance.
Common pitfall
Footprint detail is so rich that it is tempting to find "confirmation" anywhere. Deciding the location first (from the profile) keeps the footprint reading focused on the places that matter.
Key takeaways
- Profile first (where), footprint second (how), book and tape third (confirmation).
- Several independent pieces of evidence are stronger than one.
- Combined analysis still describes, it does not predict.
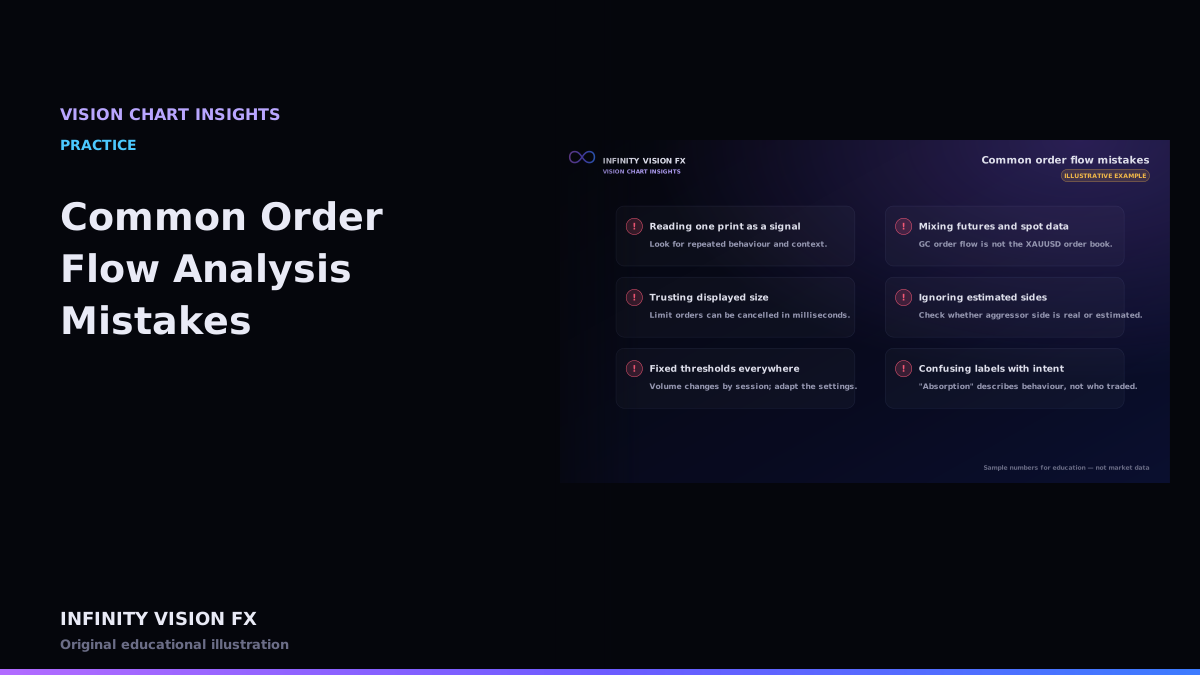
Next article: Common Order Flow Analysis Mistakes
Educational content only, not financial advice. Examples and illustrations use sample numbers and are not observations of real market activity. Order flow describes past and present activity; it does not predict prices.