Stacked Imbalance Analysis
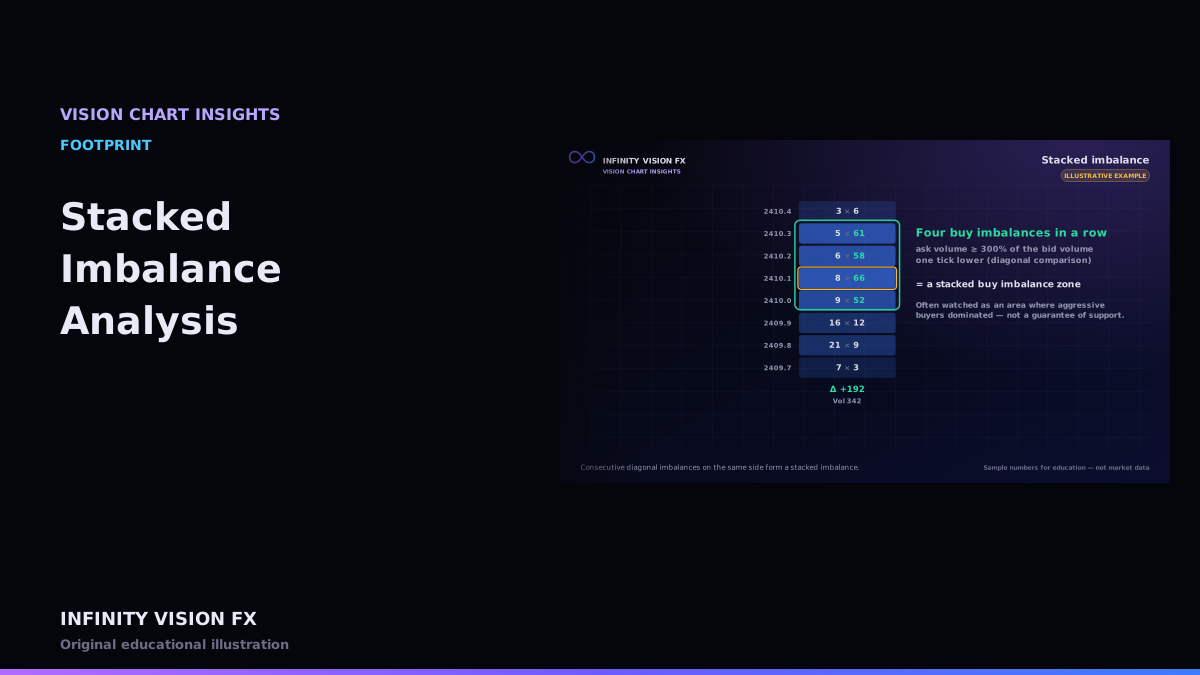
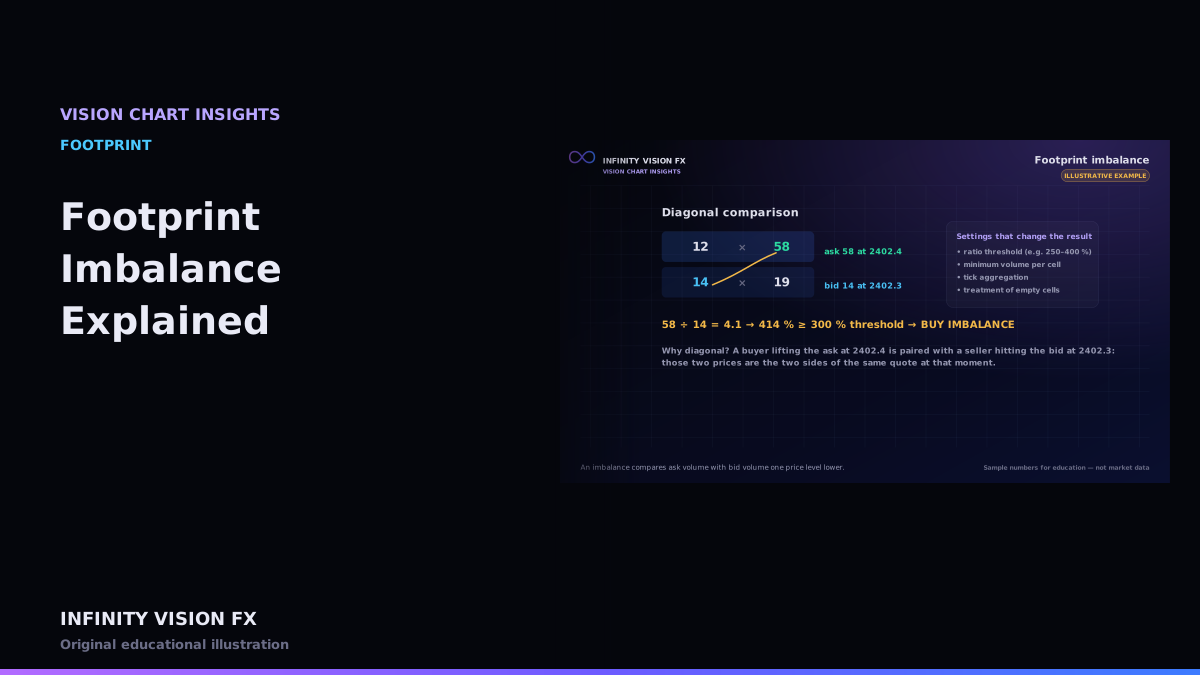
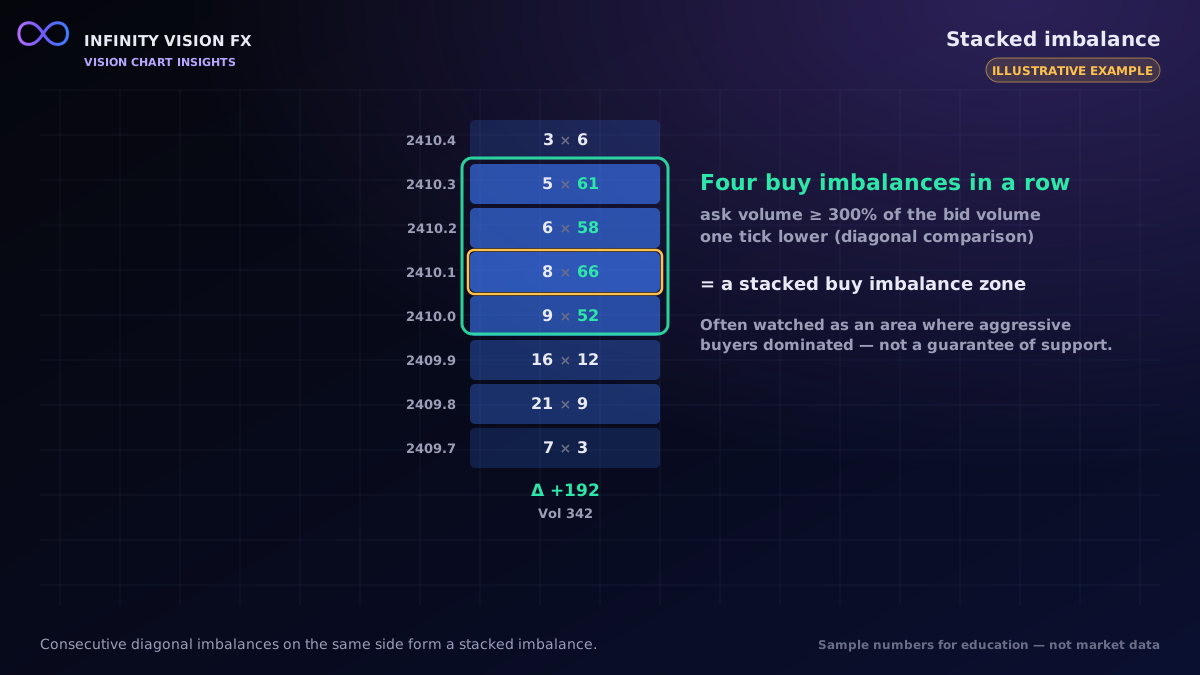
One imbalance is a single cell. A stacked imbalance is a run of consecutive price levels, all with imbalances on the same side.
Detection in VISION CHART
- Find all buy (or sell) imbalances in a candle, using your ratio and minimum-volume settings.
- Sort them by price.
- Any run of at least N consecutive levels (default 3) is a stacked imbalance, reported with its top, bottom and number of levels.
Why traders watch them
A stack shows that aggressive participants on one side were dominant across several adjacent prices, not just one. Many traders mark the stack's zone and observe how price behaves when it revisits it later. Whether the zone acts as support or resistance is something to observe, not to assume.
Using them carefully (illustrative)
- A buy stack at the bottom of an up move that later holds on a retest shows the zone mattered in that case.
- A buy stack at the top of an exhausted move can also appear just before price turns — late aggressive buyers.
A worked example (illustrative)
In one candle, buy imbalances appear at 2410.0, 2410.1, 2410.2 and 2410.3. Sorted by price, they are consecutive ticks, so VISION CHART reports one stacked buy imbalance from 2410.0 to 2410.3, 4 levels. If 2410.2 had no imbalance, it would instead be two runs of 2 and 1 — below the default minimum of 3, so no stack.
Observing stacks over time
The Pattern Builder can count stacked levels per bar (positive for buy stacks, negative for sell stacks) and list every past bar that met your rule, with what price did over the following bars. Results under 20 matches are not shown as percentages, because tiny samples are misleading.
Limitations
- Changing the ratio, the minimum volume or the tick aggregation changes which stacks exist.
- A stack describes one candle; it can be erased by later trading through the zone.
Key takeaways
- A stack = consecutive same-side imbalances.
- Settings (ratio, minimum volume, run length) define it.
- Observe how price treats the zone later; do not assume.
Next article: Delta Divergence Explained
Educational content only, not financial advice. Examples and illustrations use sample numbers and are not observations of real market activity. Order flow describes past and present activity; it does not predict prices.