Footprint Imbalance Explained
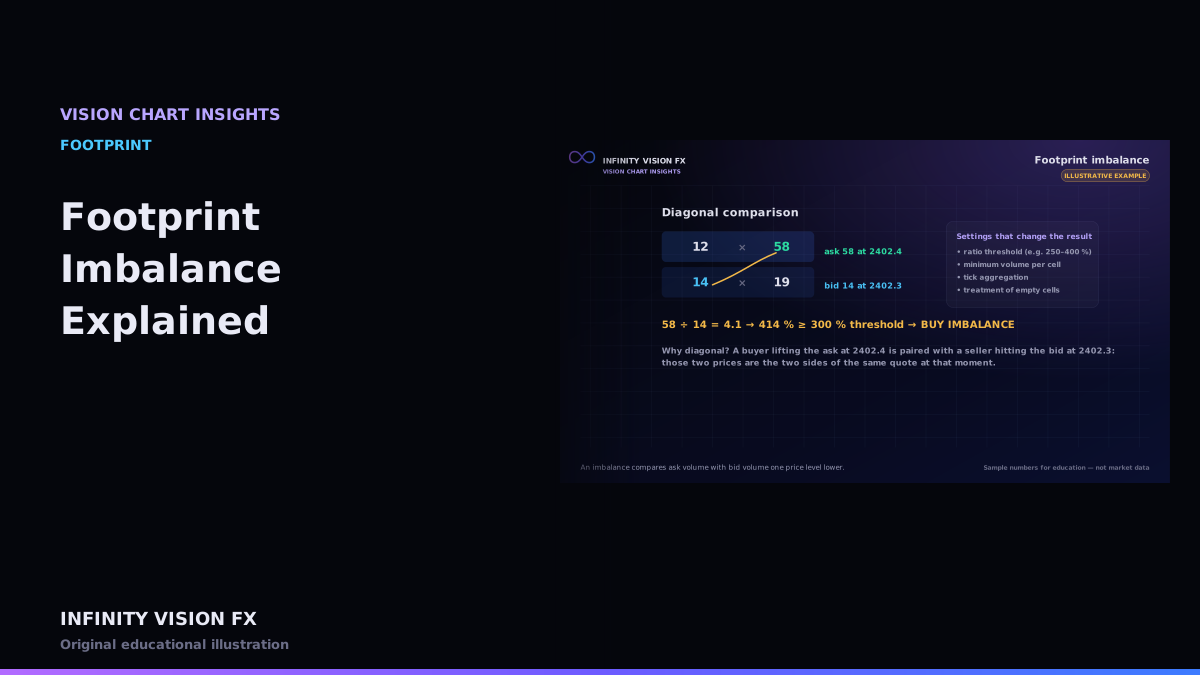
A footprint imbalance highlights a cell where one side's aggressive volume clearly outweighs the other side's. The key detail is that the comparison is diagonal.
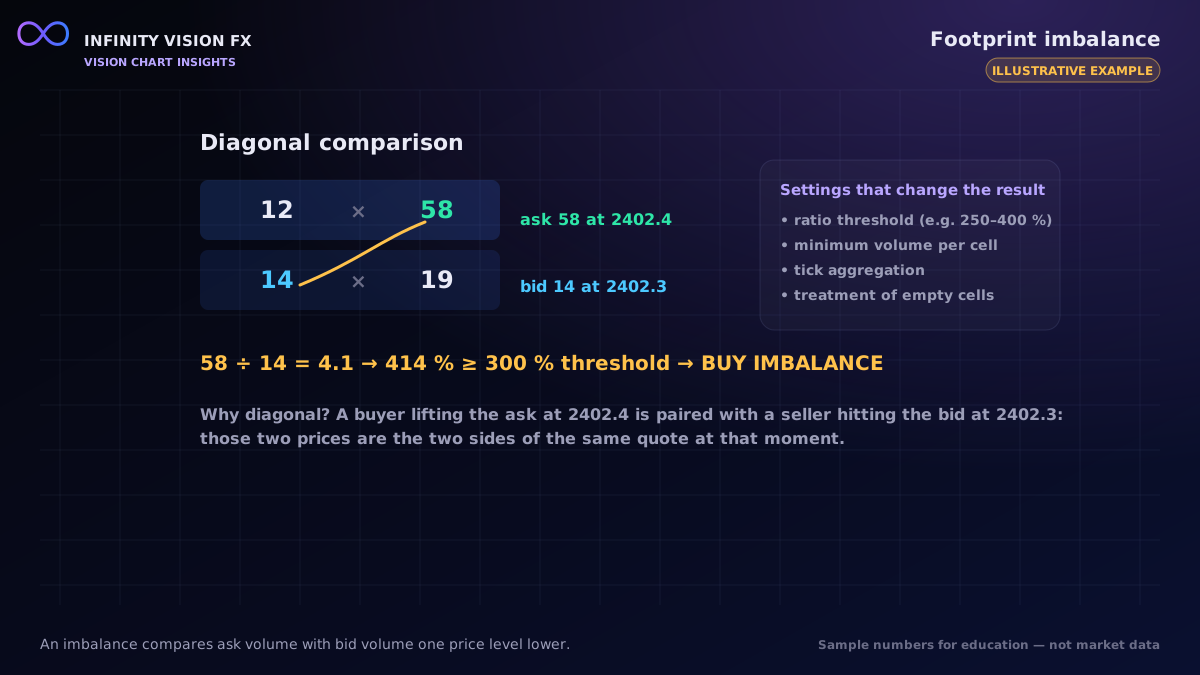
Why diagonal?
At any moment the best bid and best ask are one tick apart. An aggressive buyer at the ask (say 2402.4) is paired with an aggressive seller hitting the bid one tick lower (2402.3). So VISION CHART compares:
- Buy imbalance at P: ask volume at P vs bid volume at P − 1 level
- Sell imbalance at P: bid volume at P vs ask volume at P + 1 level
The threshold
An imbalance is shown when the ratio reaches the threshold (default 300 %) and the larger cell has at least the minimum volume (default 10 contracts). An empty opposite cell counts as zero — any cell above the minimum against an empty cell is an imbalance.
Interactive example: open this article on the Infinity Vision FX website to use it.
Percentage imbalance
Some traders prefer to express the same comparison as a percentage share — for example "ask volume is 80 % of the two cells combined". VISION CHART shows the ratio as a percentage on hover.
Settings that matter
- Ratio — lower ratios show many weak imbalances; higher ratios show few strong ones.
- Minimum volume — avoids flagging 3 × 1 cells in quiet periods.
- Tick aggregation — grouping levels changes which cells are compared.
A worked example (illustrative)
| Price | Bid | Ask |
|---|---|---|
| 2402.5 | 12 | 18 |
| 2402.4 | 22 | 58 |
| 2402.3 | 14 | 31 |
- Buy check at 2402.4: ask 58 vs bid one level lower (14) → 414 % → buy imbalance at the 300 % threshold.
- Sell check at 2402.4: bid 22 vs ask one level higher (18) → 122 % → no sell imbalance.
- Buy check at 2402.5: ask 18 vs bid 22 below → 82 % → none.
Where imbalances appear
Imbalances often cluster at the edges of fast moves, where one side crossed the spread repeatedly. A single imbalance in a slow, thin market can be just a handful of contracts — which is why the minimum-volume setting exists.
Data requirements
Executed trades with aggressor side at every price. Imbalances calculated from estimated sides inherit the estimation errors.
Key takeaways
- Imbalances compare diagonally because bid and ask are one tick apart.
- A ratio threshold and a minimum volume define what counts.
- Imbalances describe aggression at a price; context decides their importance.
Next article: Stacked Imbalance Analysis
Educational content only, not financial advice. Examples and illustrations use sample numbers and are not observations of real market activity. Order flow describes past and present activity; it does not predict prices.