Understanding Order Book Imbalance
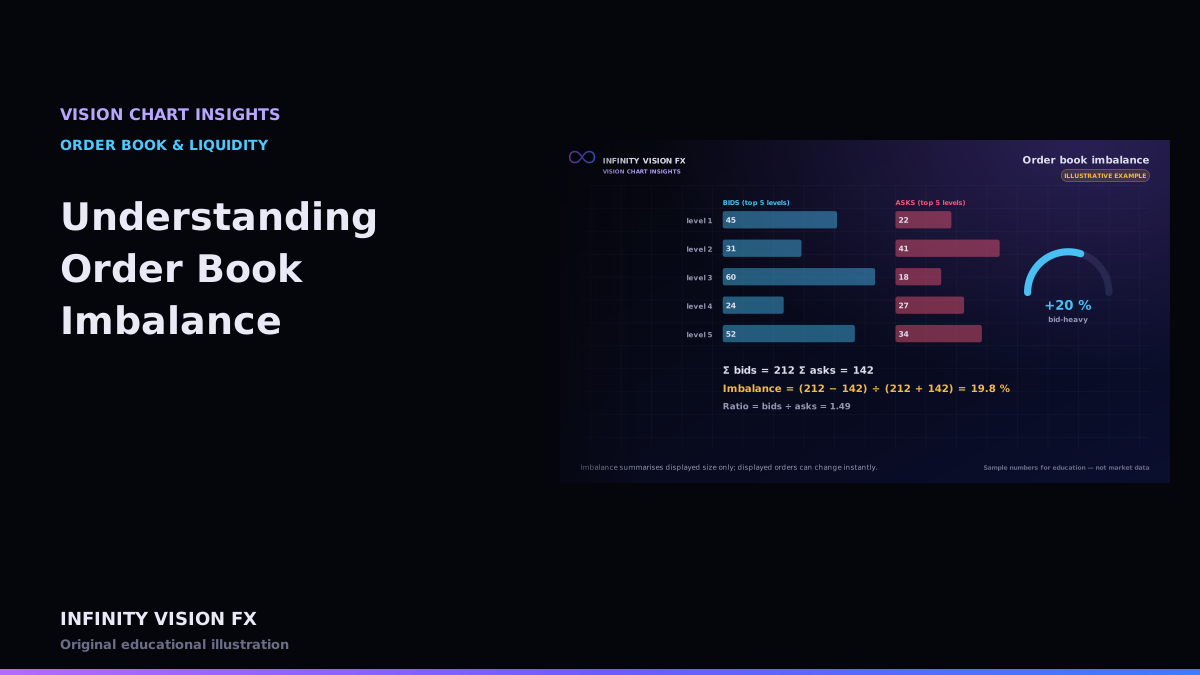
Order book imbalance compares the size waiting on the bid side with the size waiting on the ask side. It is a quick summary of displayed liquidity around the market.
The formulas
For the best N levels on each side:
- Depth ratio = total bid size ÷ total ask size
- Imbalance = (bid size − ask size) ÷ (bid size + ask size), from −100 % (all asks) to +100 % (all bids)
Variations in VISION CHART
- Configurable depth window — 1, 5, 10 or 20 levels. A single level reacts fast; deeper windows are steadier.
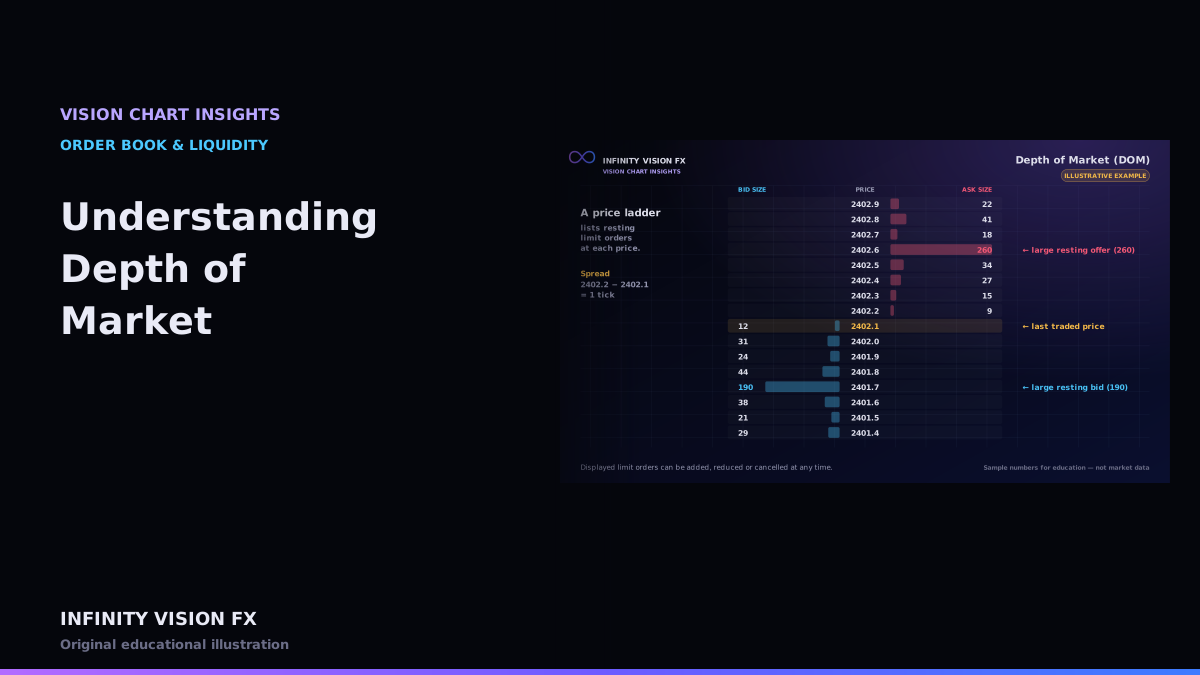
- Price-level imbalance — bid vs ask size at each row of the DOM.
- Imbalance history — the value sampled over time, so you can see pressure shifting.
Why it is fragile
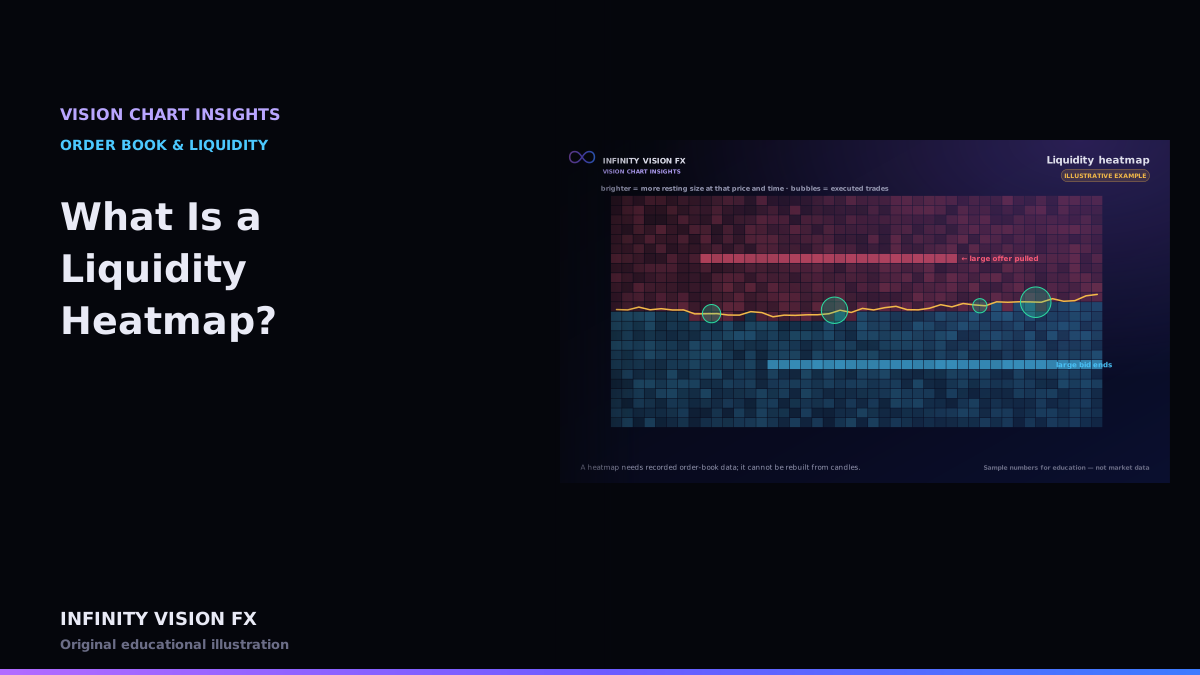
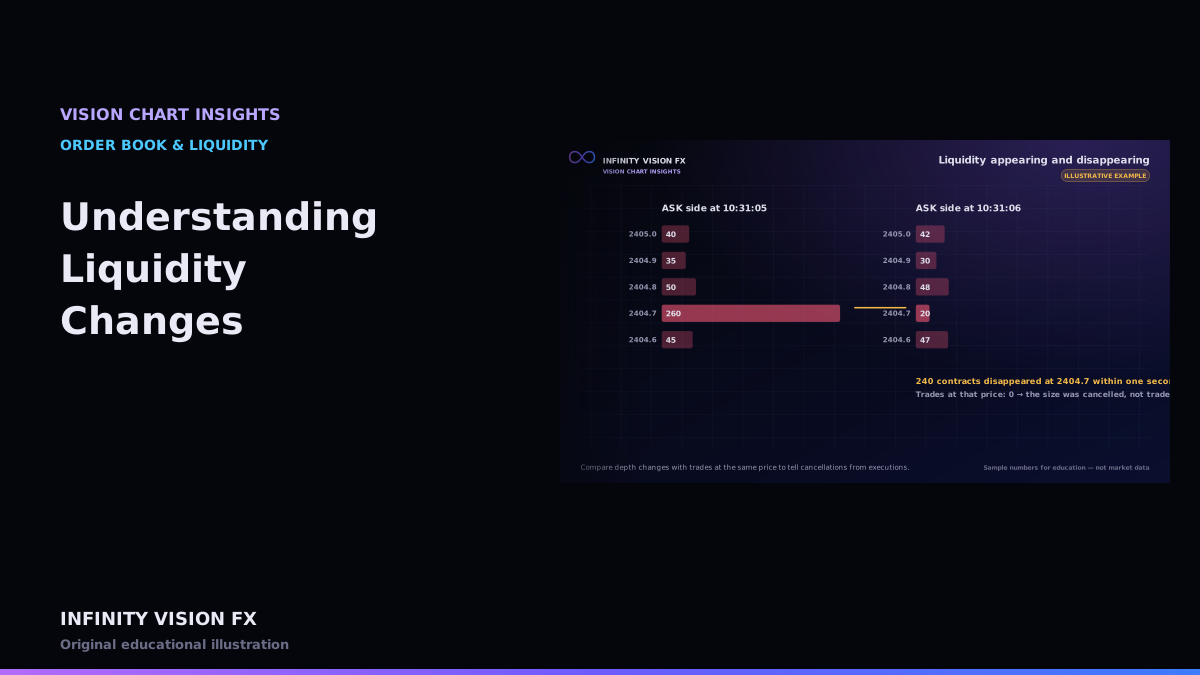
Displayed size can be added and cancelled in milliseconds. Some participants place size they never intend to trade, and hidden orders do not count at all. An imbalance can therefore flip instantly without any trade.
Data requirements
Real-time Level 2 depth with sequence numbers, so the book stays accurate. If updates are missed, the book is resynchronised from a fresh snapshot rather than guessed.
A worked example (illustrative)
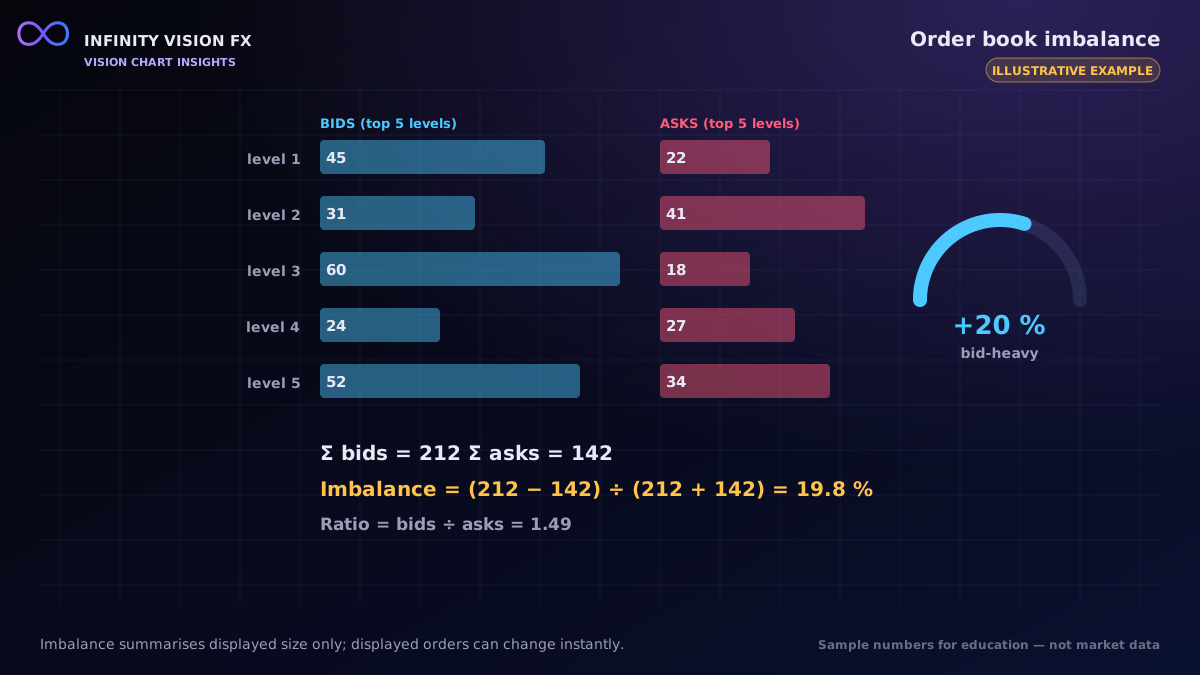
Top five levels:
| Level | Bid size | Ask size |
|---|---|---|
| 1 | 45 | 22 |
| 2 | 31 | 41 |
| 3 | 60 | 18 |
| 4 | 24 | 27 |
| 5 | 52 | 34 |
Σ bid = 212, Σ ask = 142. Imbalance = (212 − 142) ÷ (212 + 142) = +19.8 %; ratio = 1.49.
Interactive example: open this article on the Infinity Vision FX website to use it.
Reading imbalance history
A single reading is noisy. VISION CHART samples imbalance every second and shows it as a line. A bid-heavy book that stays bid-heavy while price falls tells a different story from one that flips to ask-heavy as price falls: in the first case, buyers' displayed orders are being hit; in the second, they are being withdrawn.
Limitations
- Only displayed size counts; hidden orders are invisible.
- A single very large order can dominate the calculation; check the per-level view.
Key takeaways
- Imbalance compares displayed bid and ask size over a depth window.
- Shallow windows react fast; deep windows are smoother.
- Displayed size is fragile — confirm with executed trades.
Next article: Speed of Tape Explained
Educational content only, not financial advice. Examples and illustrations use sample numbers and are not observations of real market activity. Order flow describes past and present activity; it does not predict prices.