Understanding Liquidity Changes
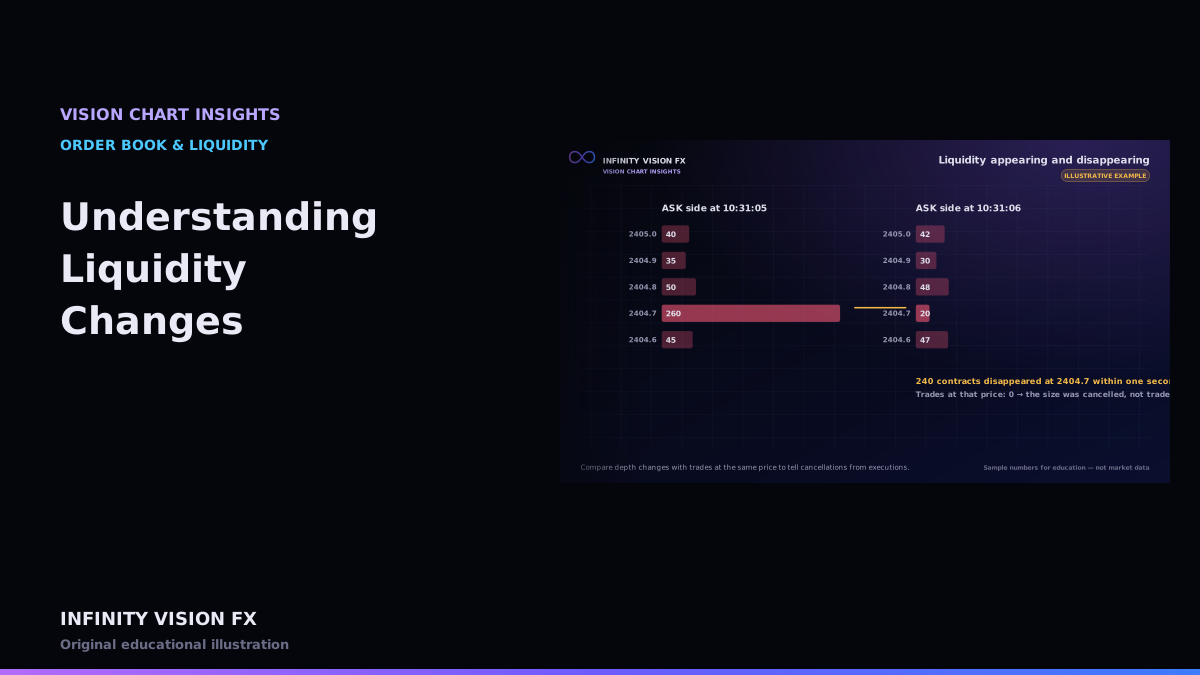
Displayed size at a price changes for two reasons: orders are executed (traded) or orders are added, reduced or cancelled. Telling them apart is one of the most useful skills in reading an order book.
The method
For a price where displayed size dropped:
- Measure the drop in displayed size between two book states.
- Add up trades at that price on the matching side in the same interval.
- If trades ≈ drop → the size was executed. If trades ≈ 0 → it was cancelled. In between → partly both.
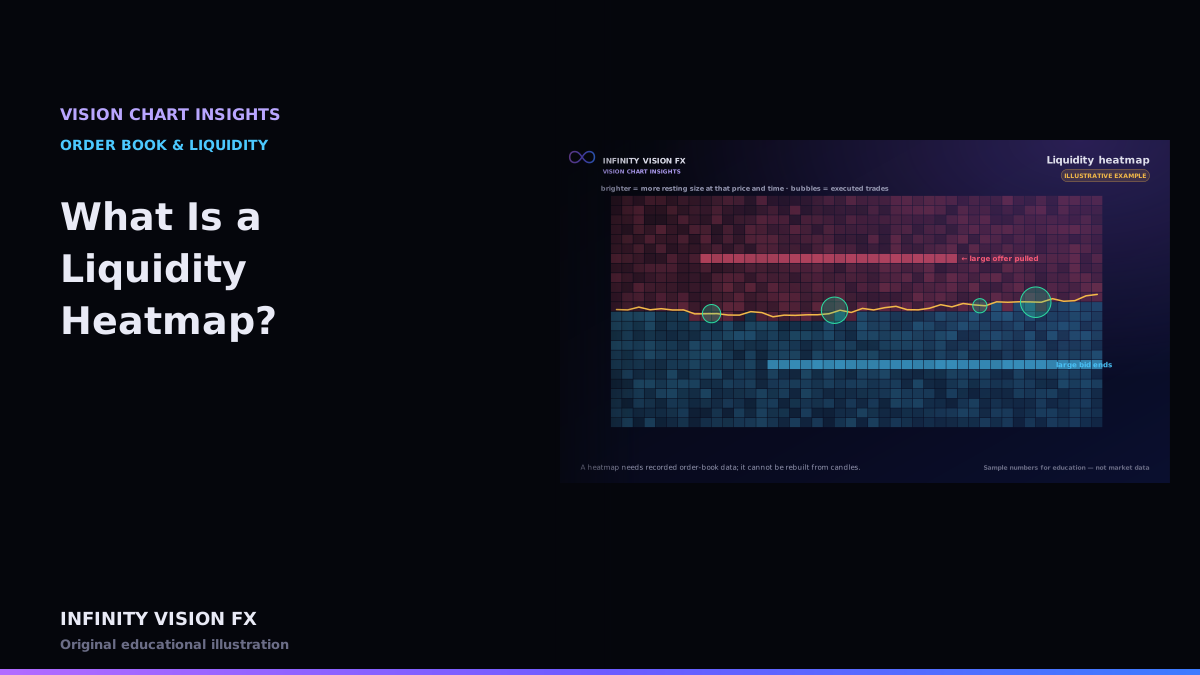
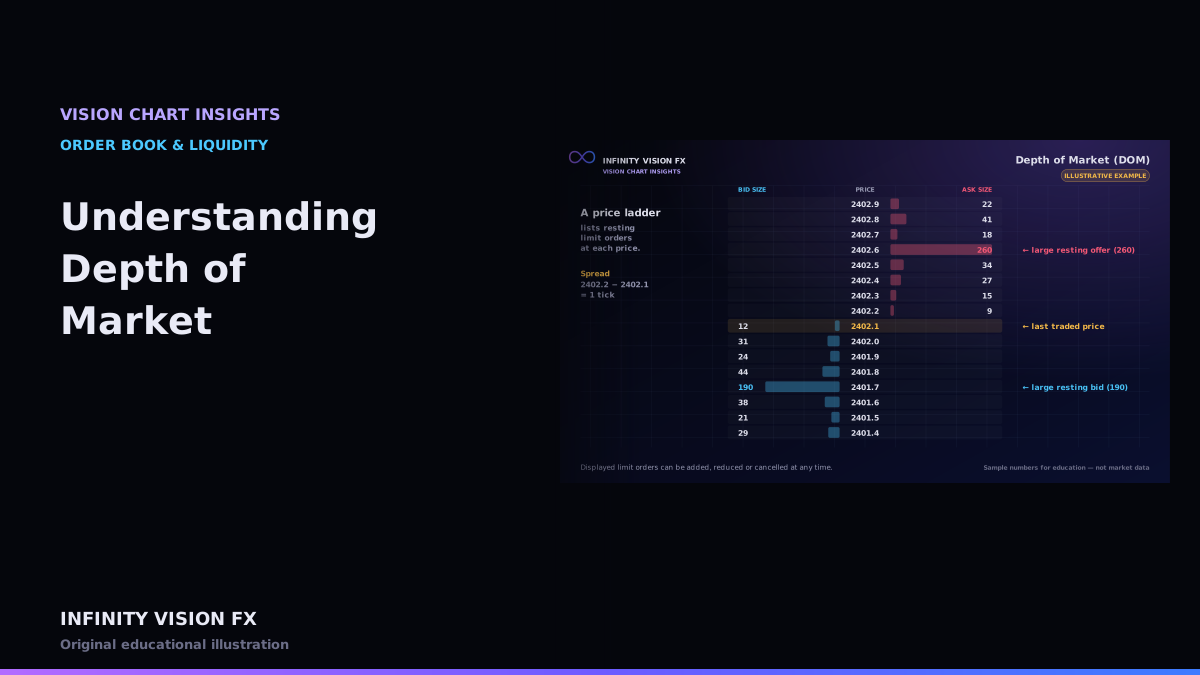
VISION CHART's heatmap marks appearance and disappearance events above a size threshold, and the DOM's change column shows the latest changes.
Why it matters
- Executed size shows real willingness to trade at that price.
- Cancelled size shows that displayed liquidity was not committed — sometimes called "pulling" or, in its abusive form, spoofing. VISION CHART does not label intent; it labels what happened.
Data requirements
Accurate, sequenced depth updates and trades with exchange timestamps. Conflated or delayed feeds can make executions look like cancellations.
A worked example (illustrative)
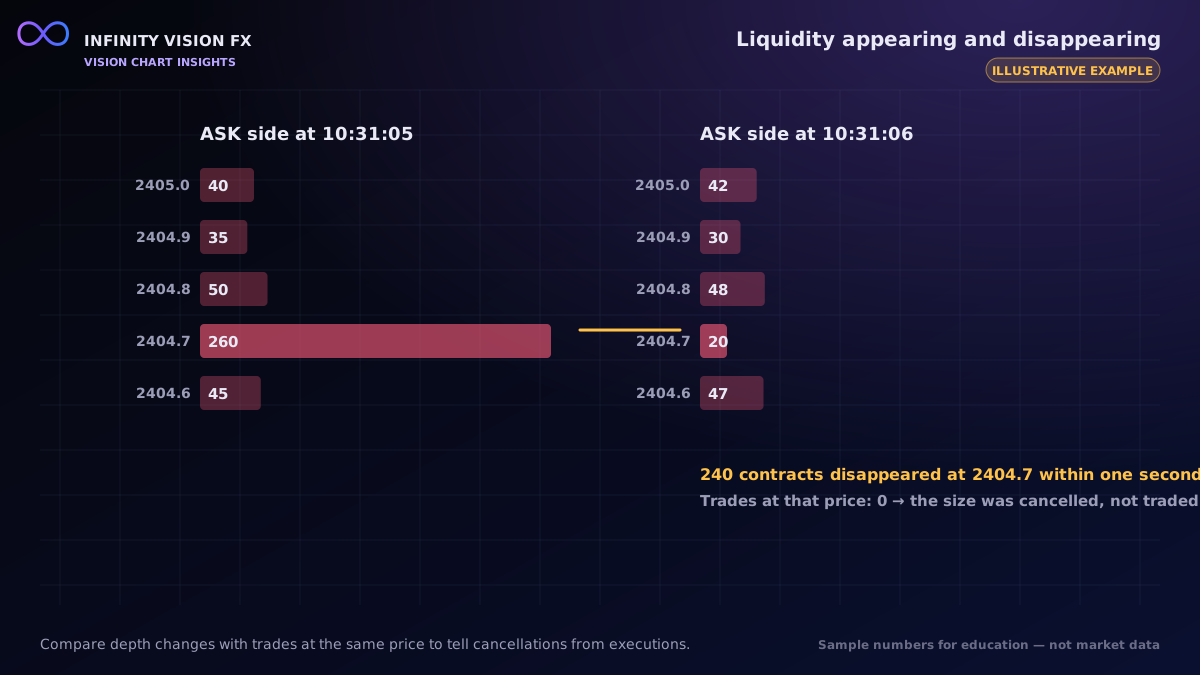
At 10:31:05 the ask at 2404.7 shows 260 contracts. One second later it shows 20.
- Drop in displayed size: 240.
- Buy-aggressor trades at 2404.7 in that second: 0.
- Conclusion: about 240 contracts were cancelled (or moved), not traded.
Had the tape shown 230 contracts bought at 2404.7, the conclusion would be that the size was mostly executed — a real willingness to sell there was met by buyers.
Partial cases
Most real changes are mixed: some contracts trade, some are cancelled, and new orders arrive at the same time. Market-by-Order data separates these cleanly because each order's add, modify, delete and fill events are visible.
Why timestamps matter
Depth and trade messages can arrive in slightly different orders through different channels. VISION CHART uses exchange timestamps and sequence numbers where the vendor provides them; with conflated data, small timing errors can blur executions and cancellations.
Key takeaways
- Size changes = executions or cancellations.
- Compare depth drops with trades at the same price and time.
- Describe what happened; do not assume intent.
Next article: Combining Footprint and Volume Profile
Educational content only, not financial advice. Examples and illustrations use sample numbers and are not observations of real market activity. Order flow describes past and present activity; it does not predict prices.