Order flow education for gold futures traders
Foundations
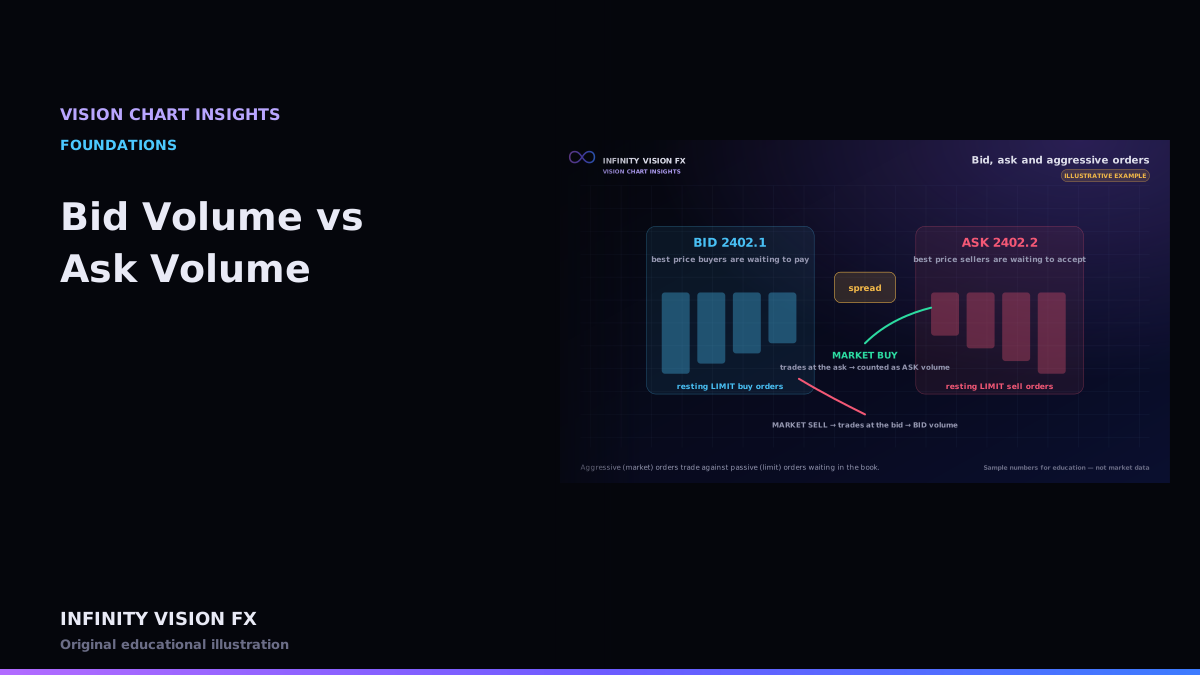
Why volume is counted "at the bid" or "at the ask", and what that does — and does not — tell you.
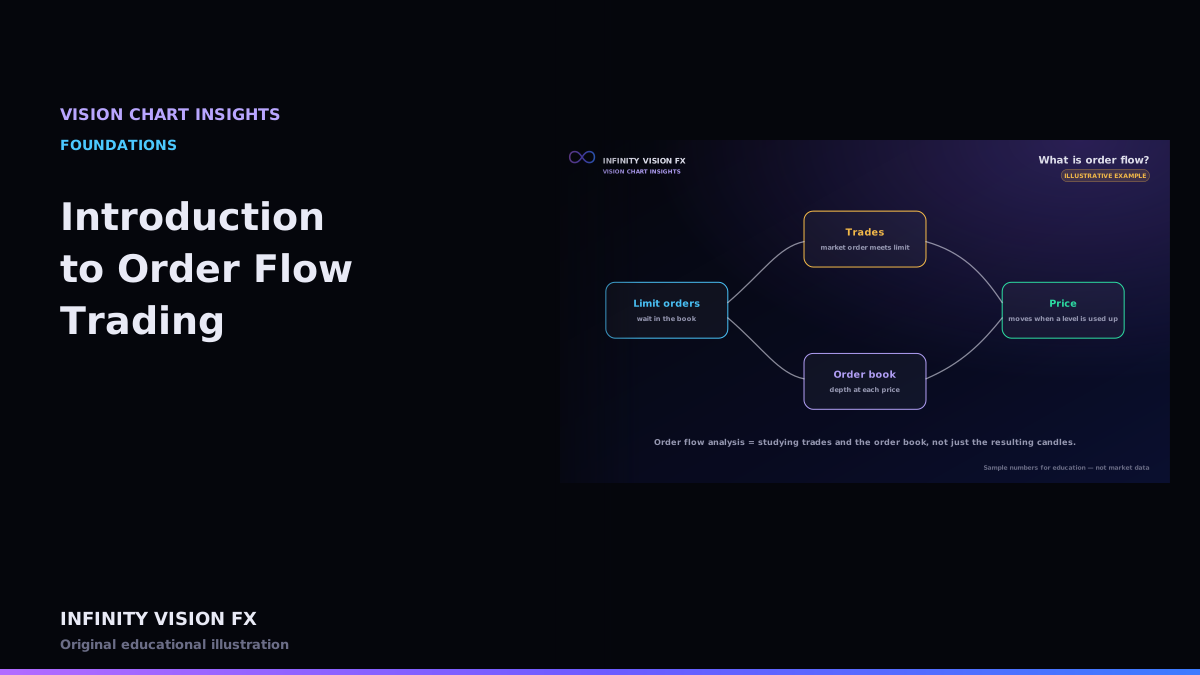
What "order flow" actually means, which data it needs, and how it differs from reading candles.
Footprint
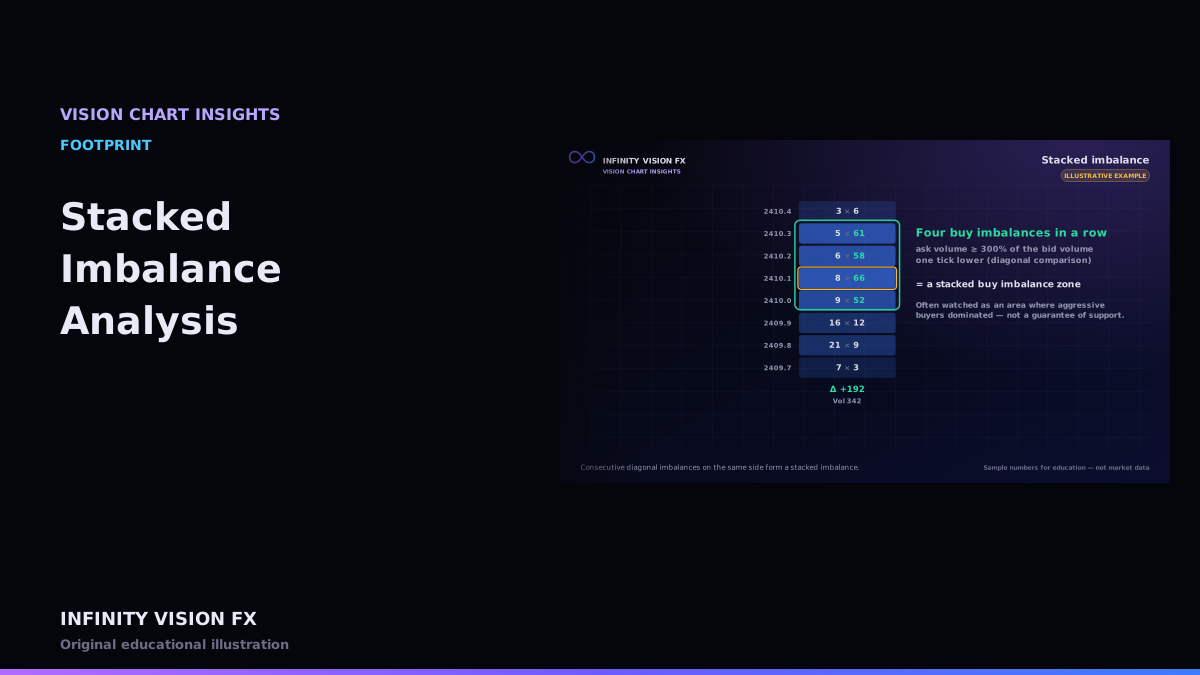
When several diagonal imbalances line up on the same side, they form a stacked imbalance. Here is how it is detected and used.
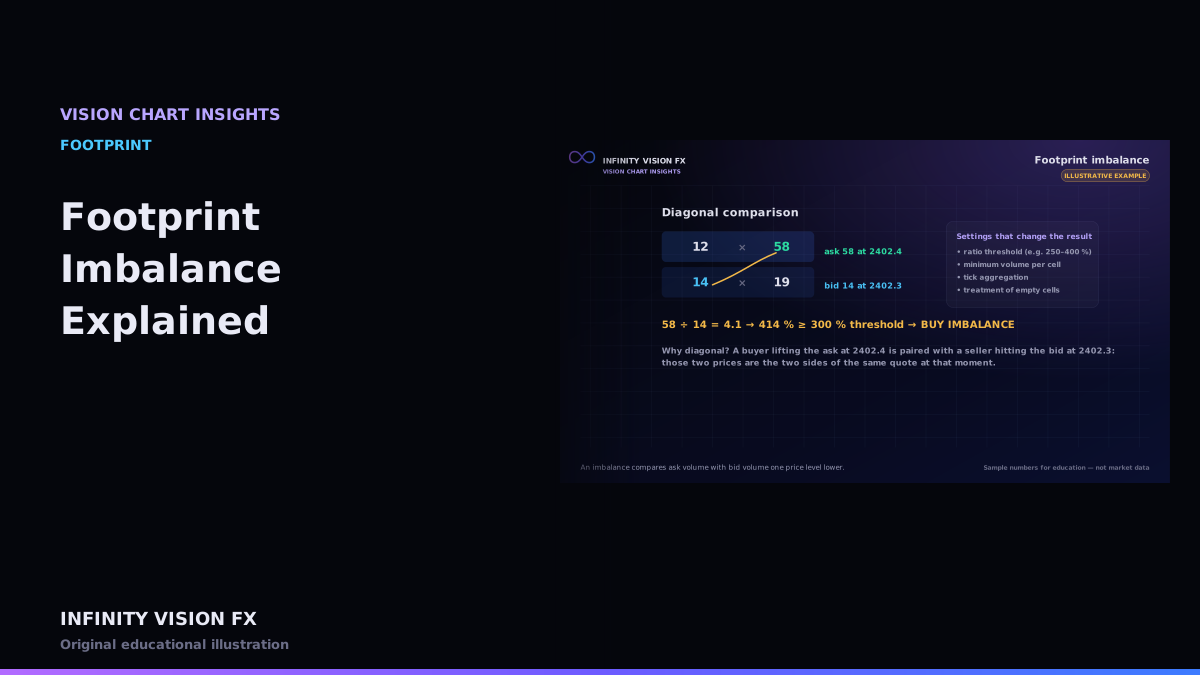
Why footprint imbalances compare diagonally, how the ratio threshold works, and which settings matter.
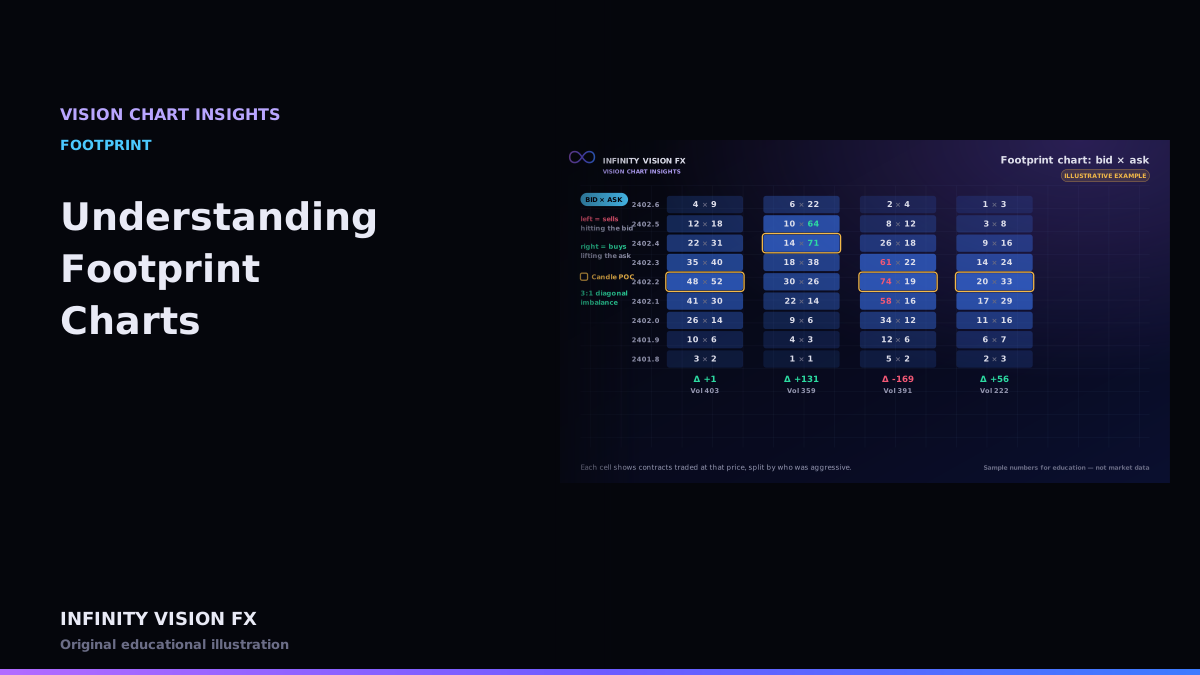
How a footprint chart splits each candle into prices and aggressor volume, and how to read it without over-reading it.
Delta & CVD
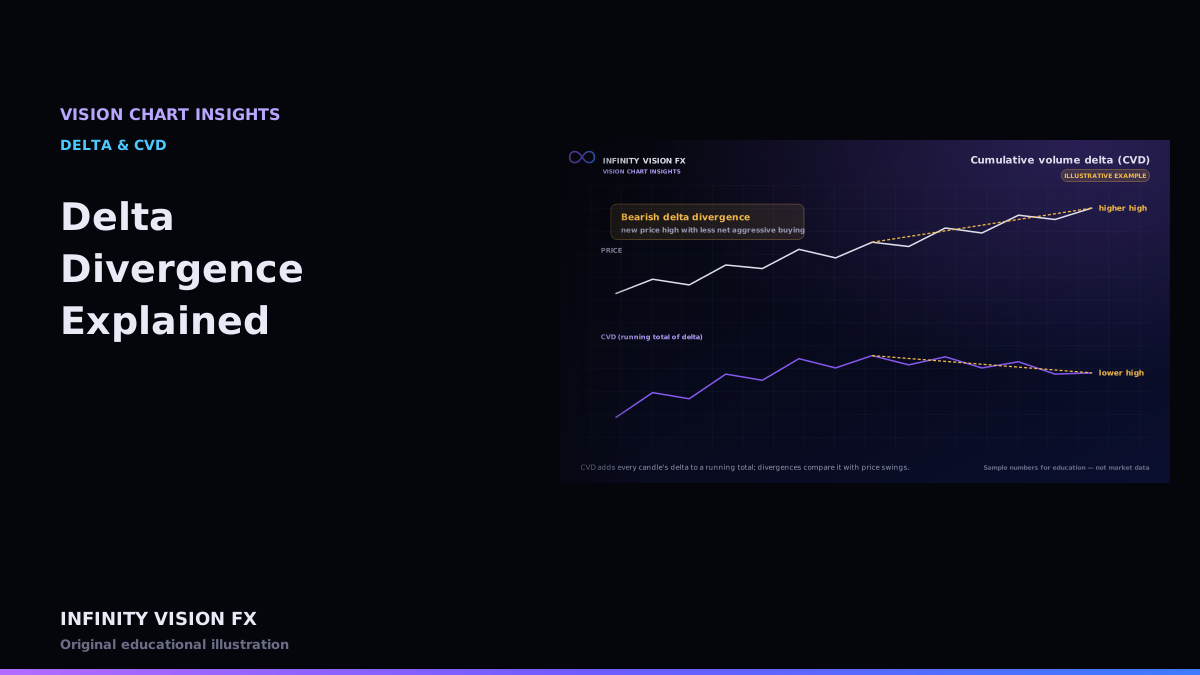
What a delta divergence is, how VISION CHART detects it without lookahead, and how to avoid common traps.
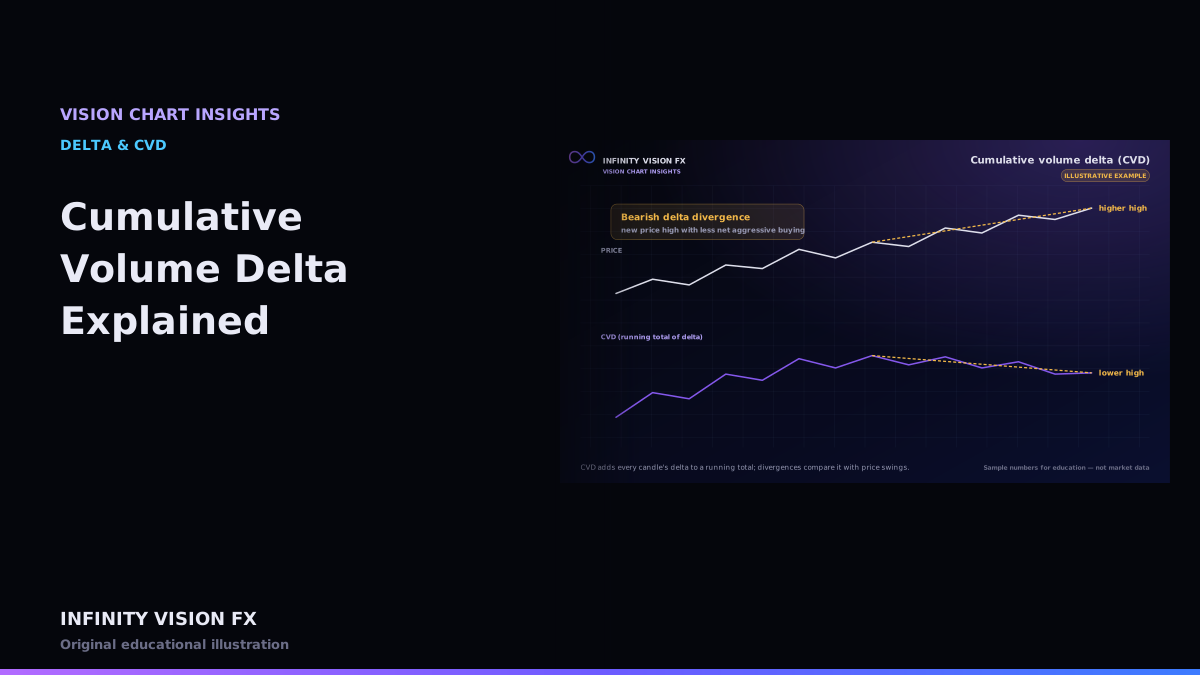
CVD keeps a running total of delta. Learn how it is built, why the reset point matters, and how divergences are measured.
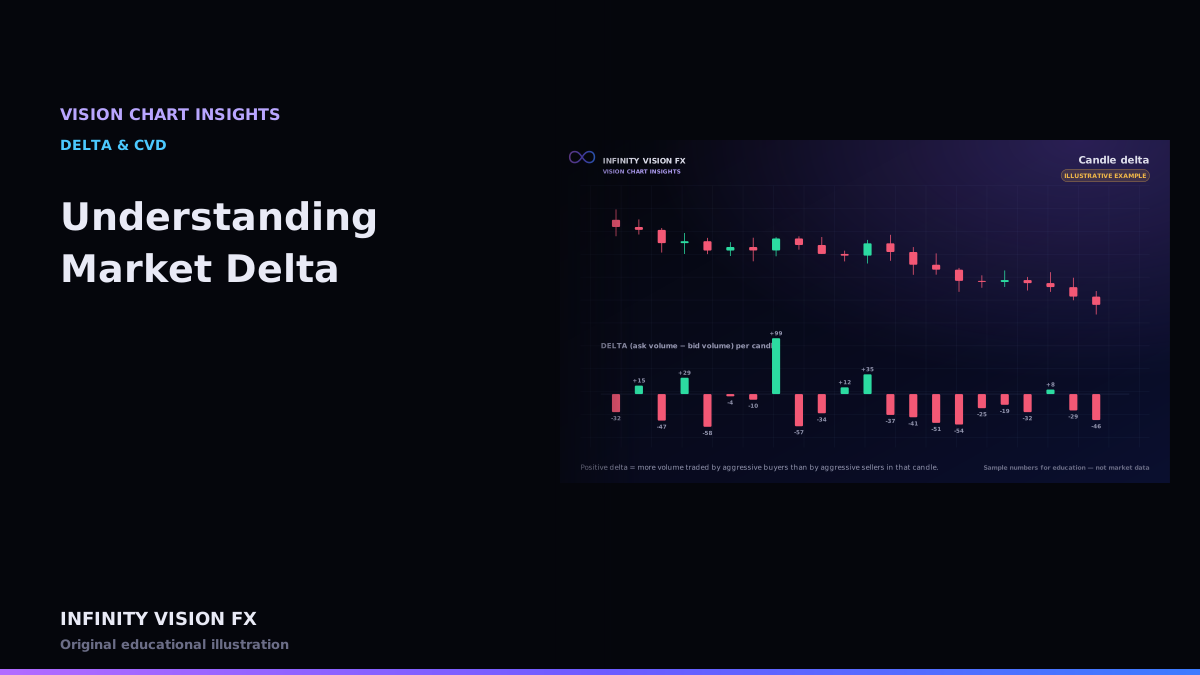
Delta is the difference between aggressive buying and aggressive selling. Here is how it is calculated and how to read it carefully.
Order Book & Liquidity
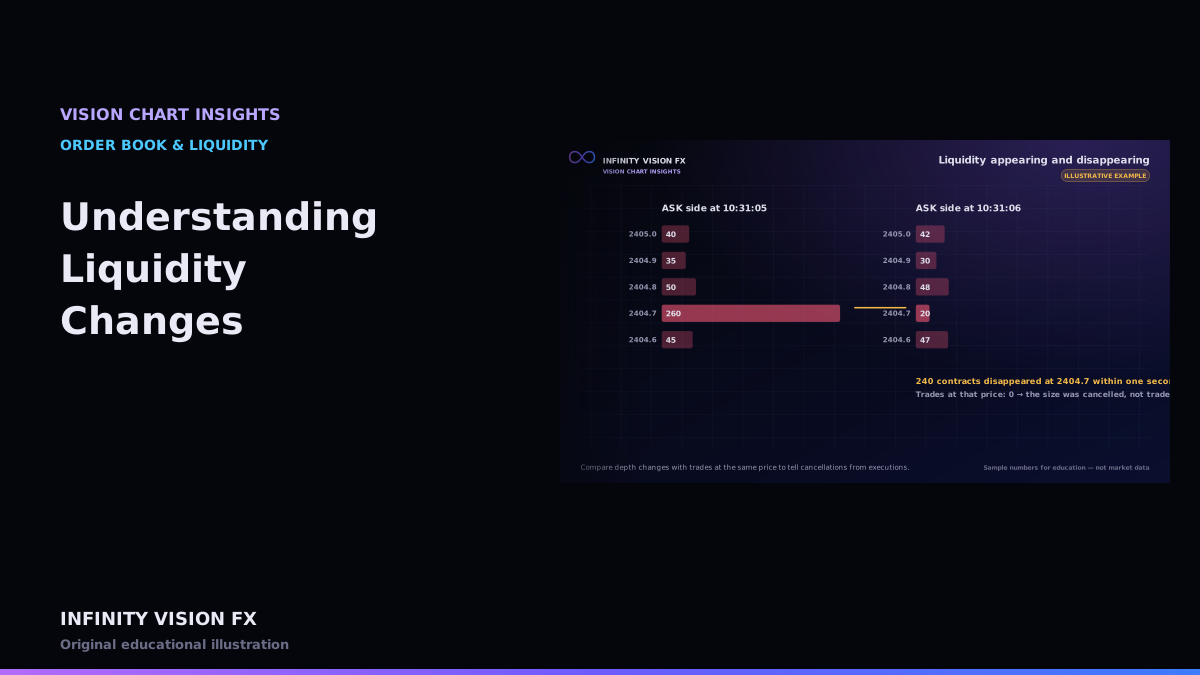
How to tell executed liquidity from cancelled liquidity, and why the difference matters.
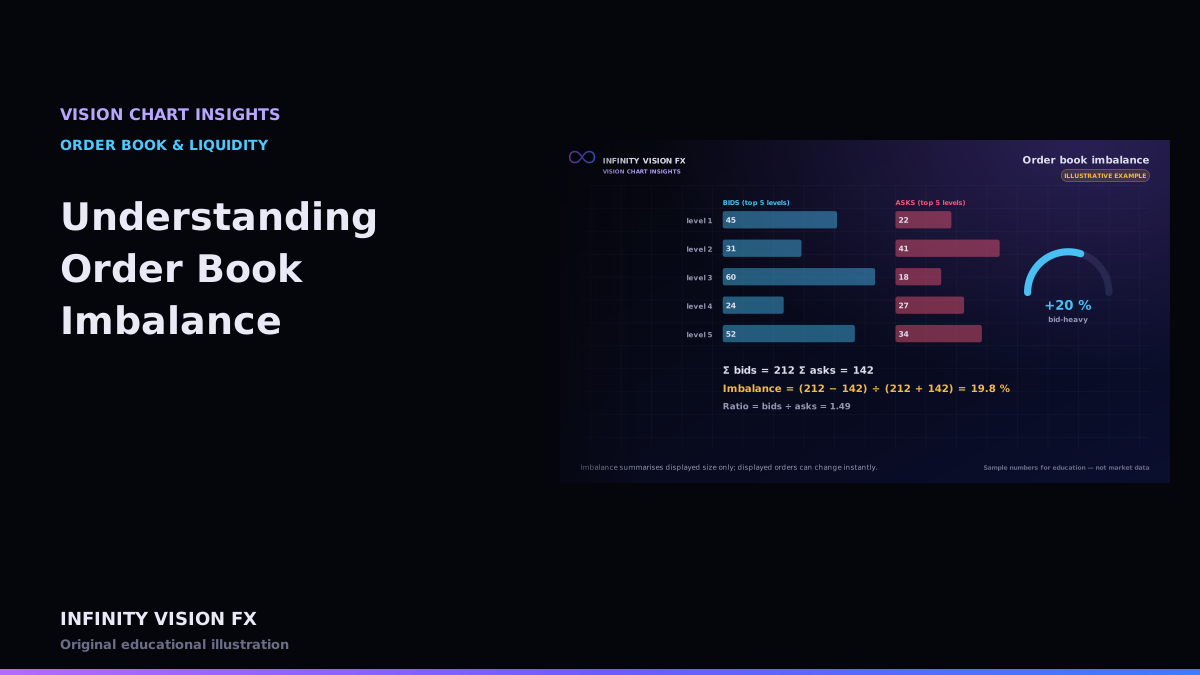
Order book imbalance compares displayed bid and ask size. Learn the formulas, depth windows and why displayed size is fragile.
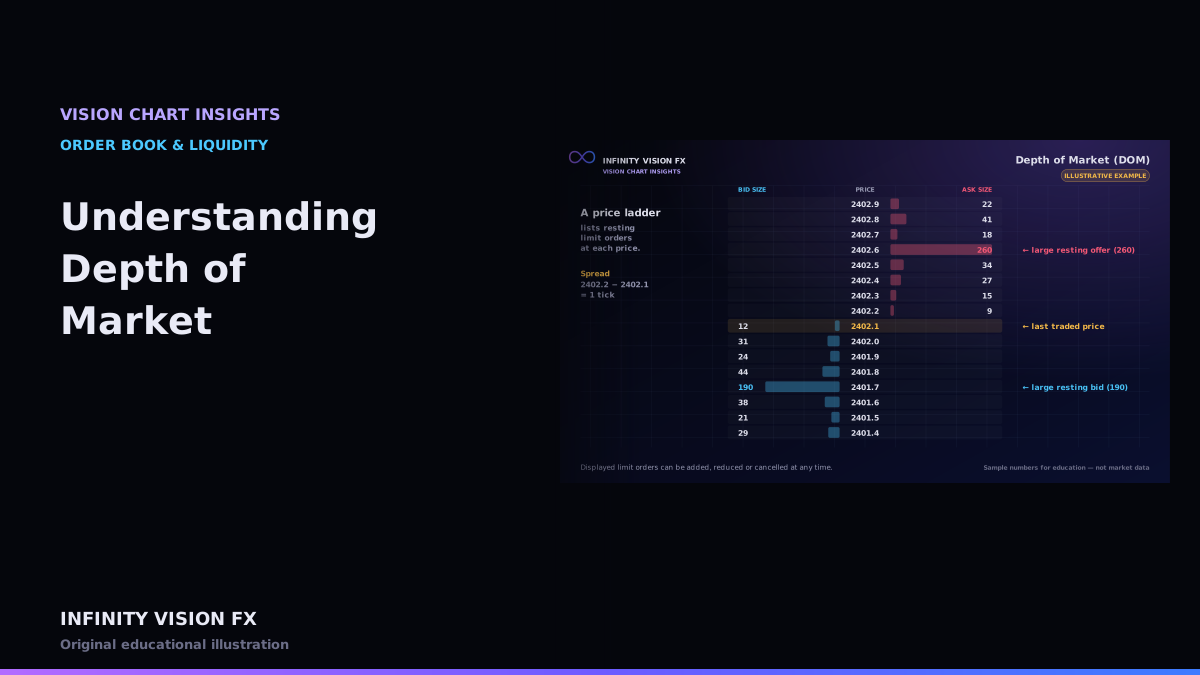
How to read a DOM price ladder: bid size, ask size, cumulative depth, and why displayed size is not a promise.
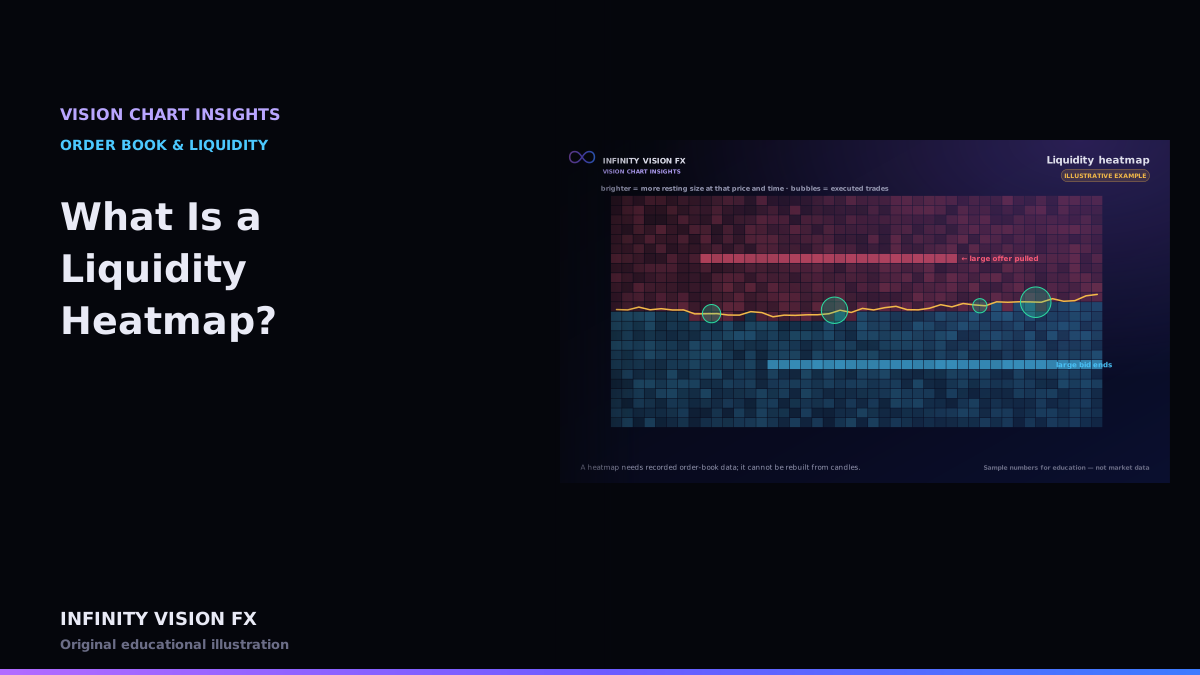
A liquidity heatmap paints resting order-book size over time. Here is what it needs, what it shows, and what it cannot prove.
Profiles
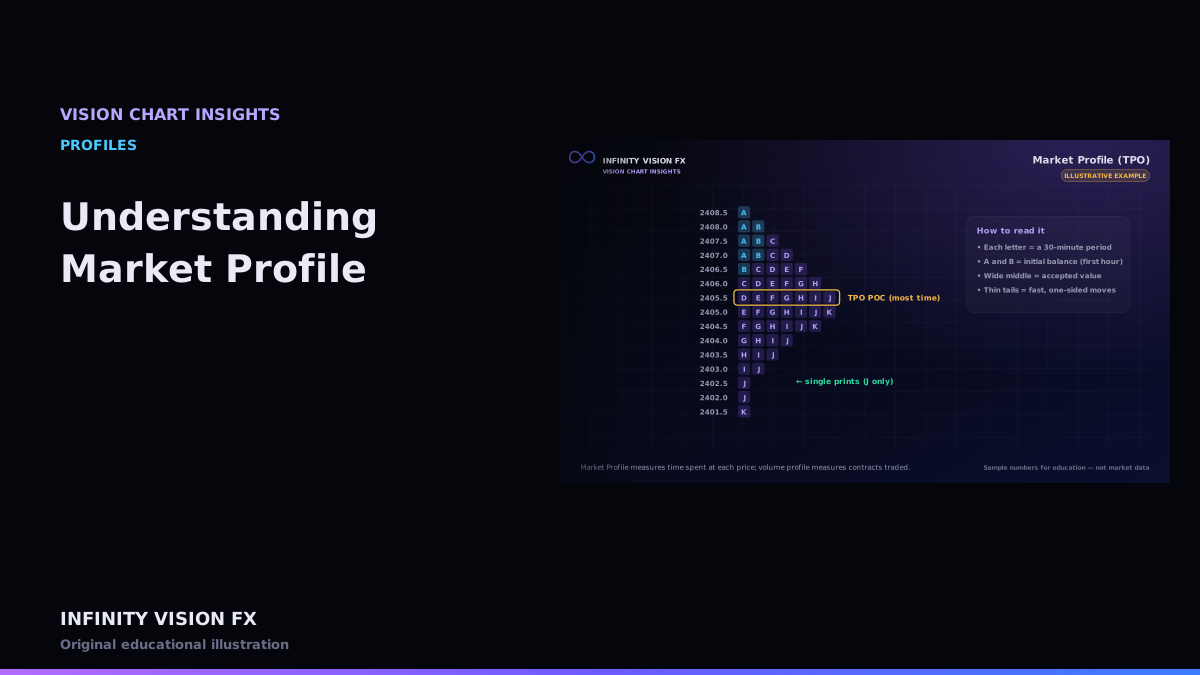
Market Profile measures time at price with letters (TPOs). Learn initial balance, single prints, poor highs and lows, and how it differs from volume profile.
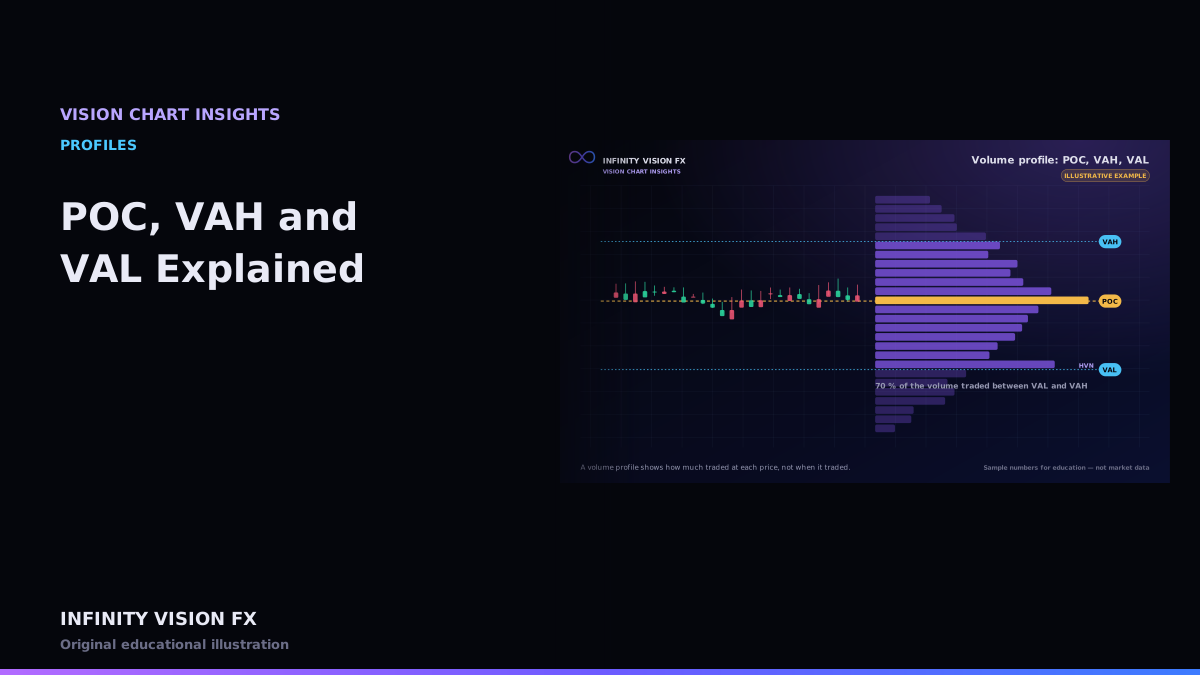
A precise look at the point of control and the value area, including the step-by-step value-area calculation used in VISION CHART.
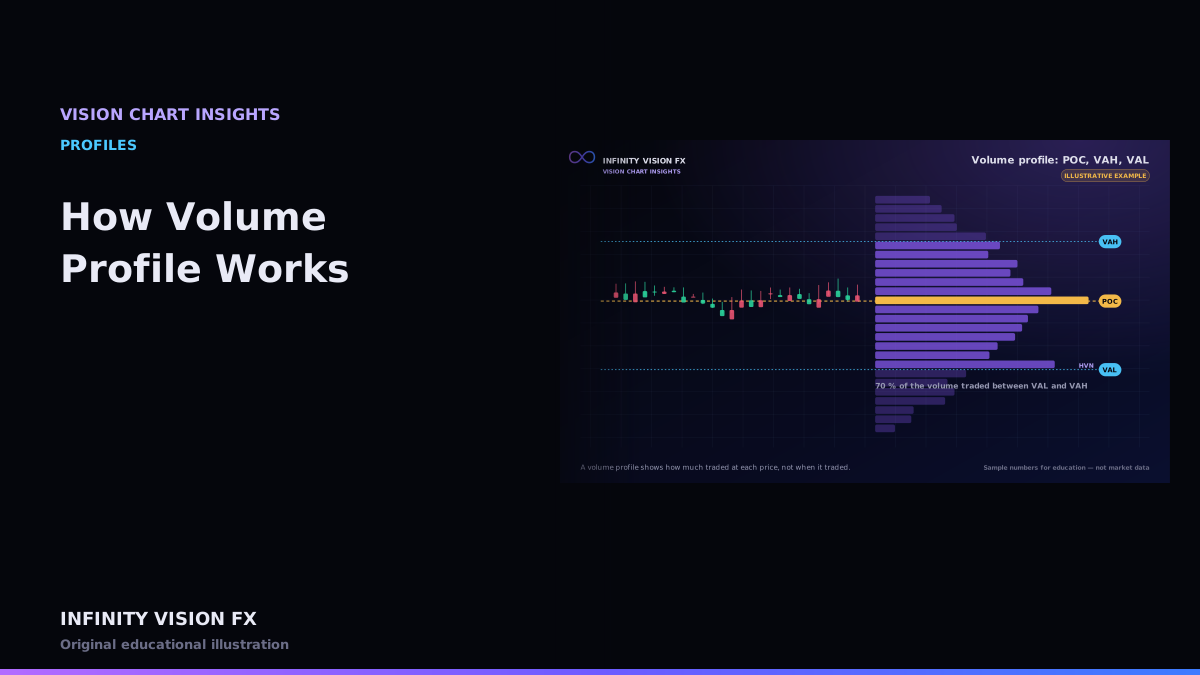
A volume profile turns time into price: it shows how much traded at each price over a chosen range. Here is how it is built.
Advanced Analysis
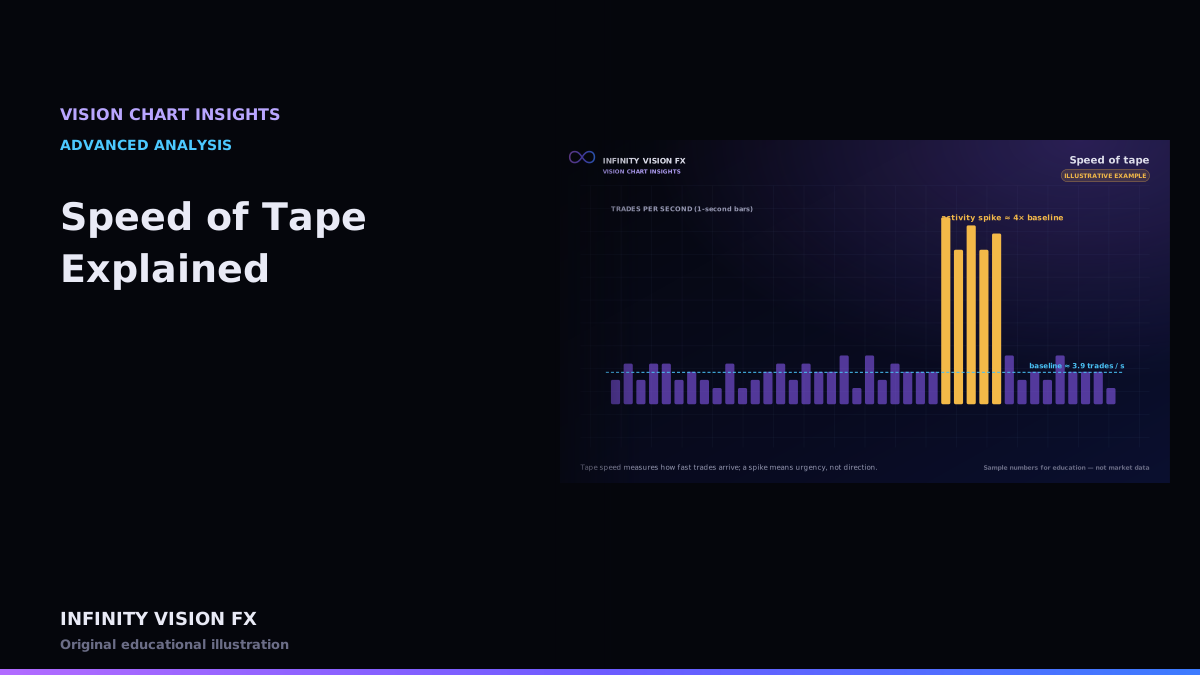
Tape speed measures how fast trades arrive. Learn the metrics, baselines and how spikes are detected.
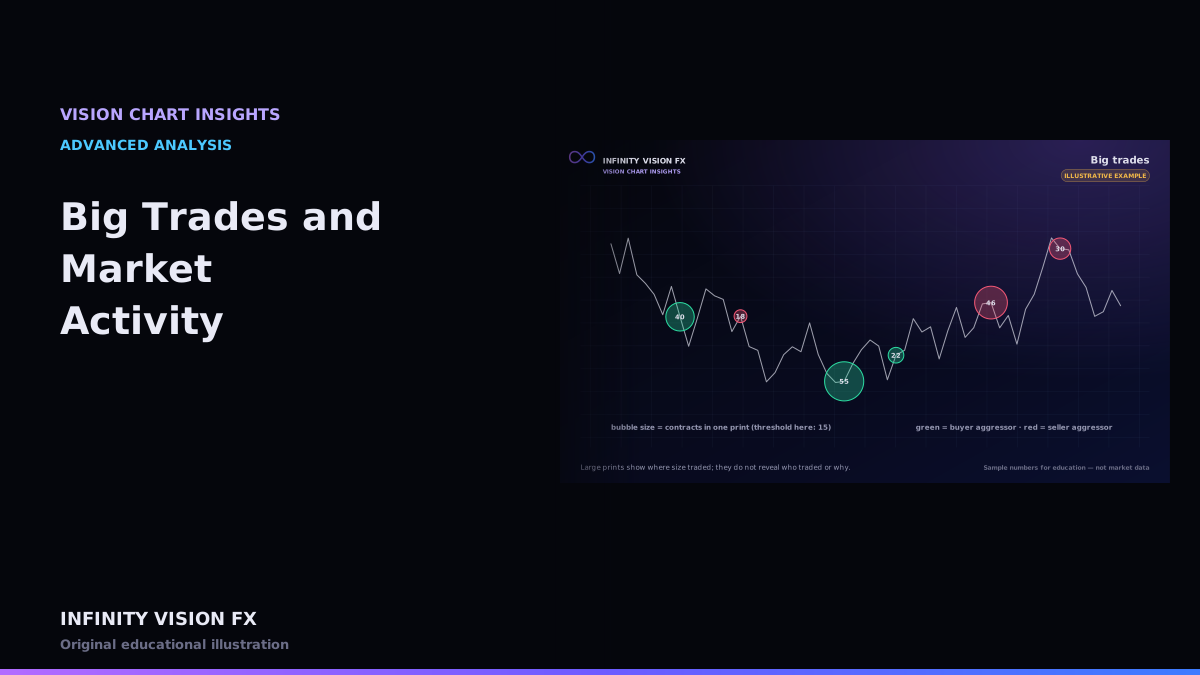
How large prints are detected, clustered and displayed — and why size alone does not reveal who traded.
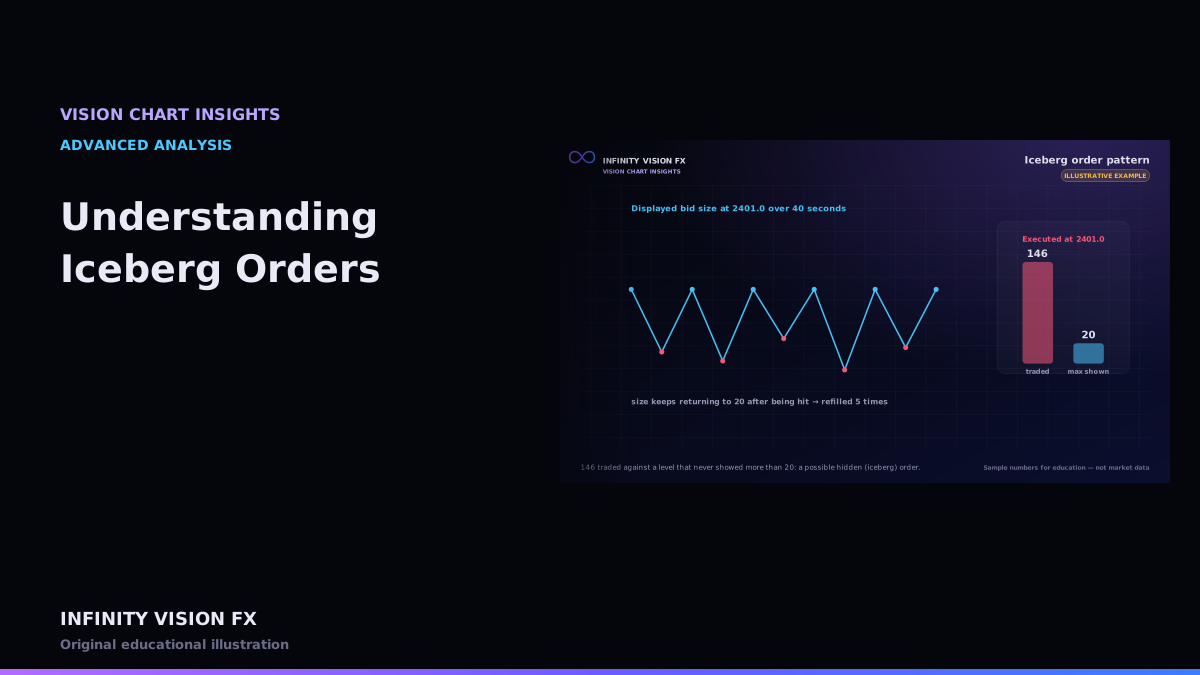
Iceberg orders show only part of their size. Learn the replenishment pattern, the data required to detect it, and its limits.
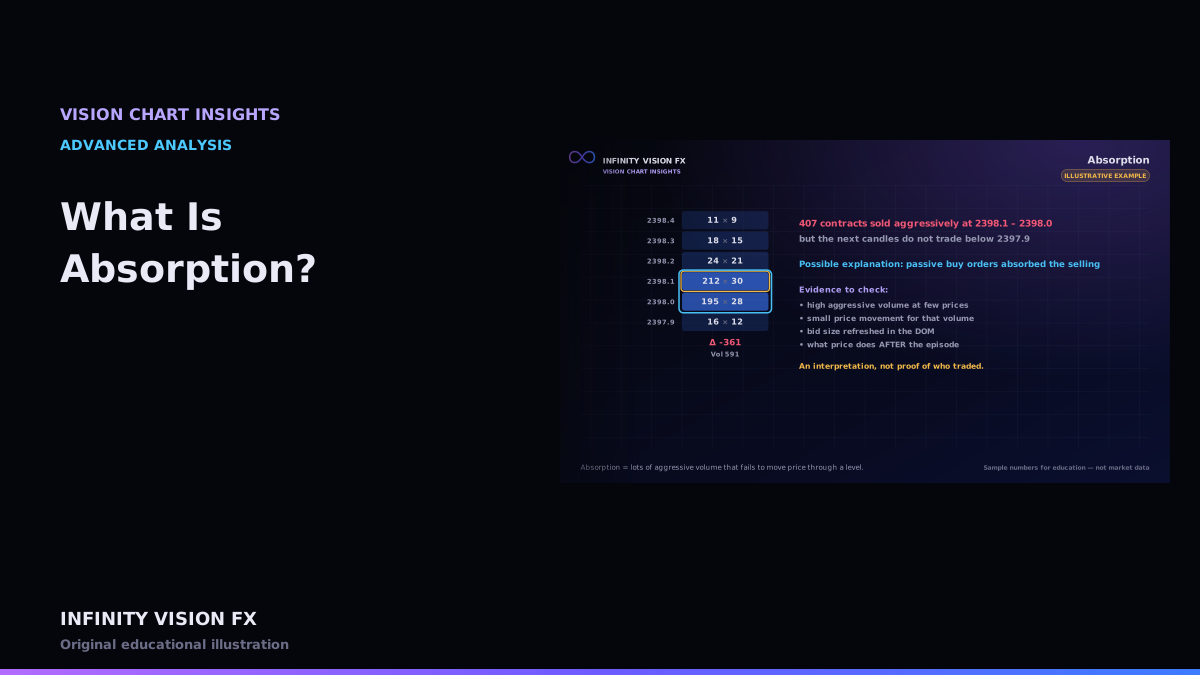
Absorption describes heavy aggressive volume that fails to move price. Here is the evidence to look for and why it stays an interpretation.
Gold Futures
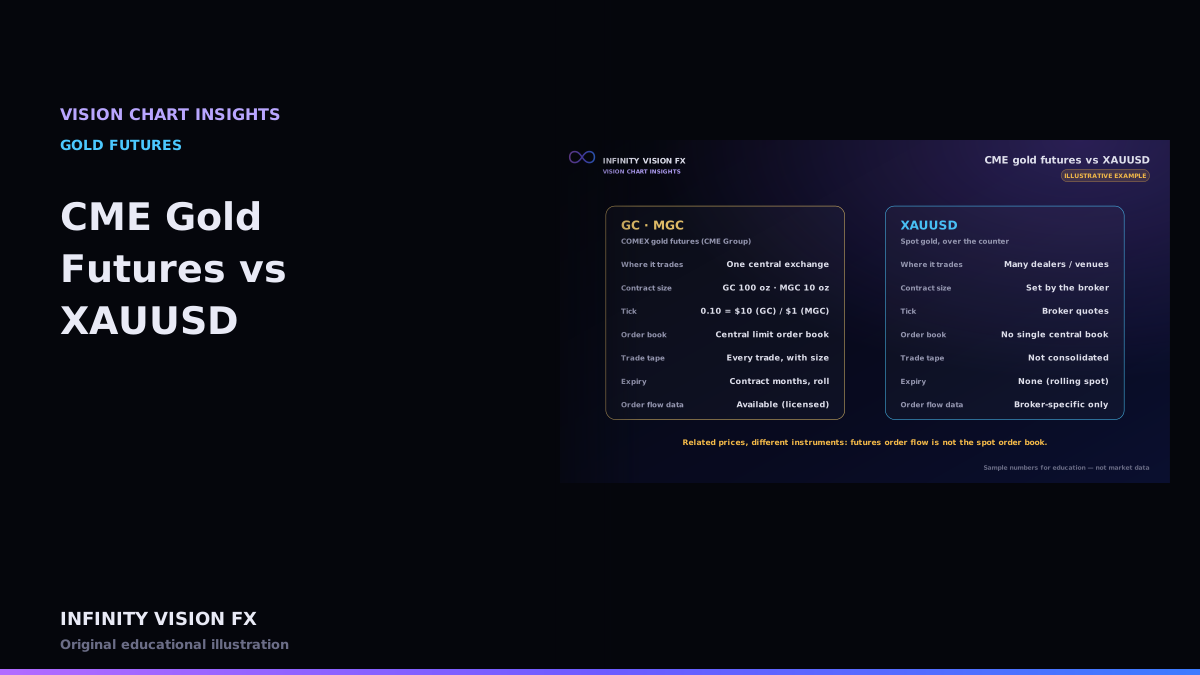
Why COMEX gold futures order flow is not the XAUUSD order book, and how the two prices relate.
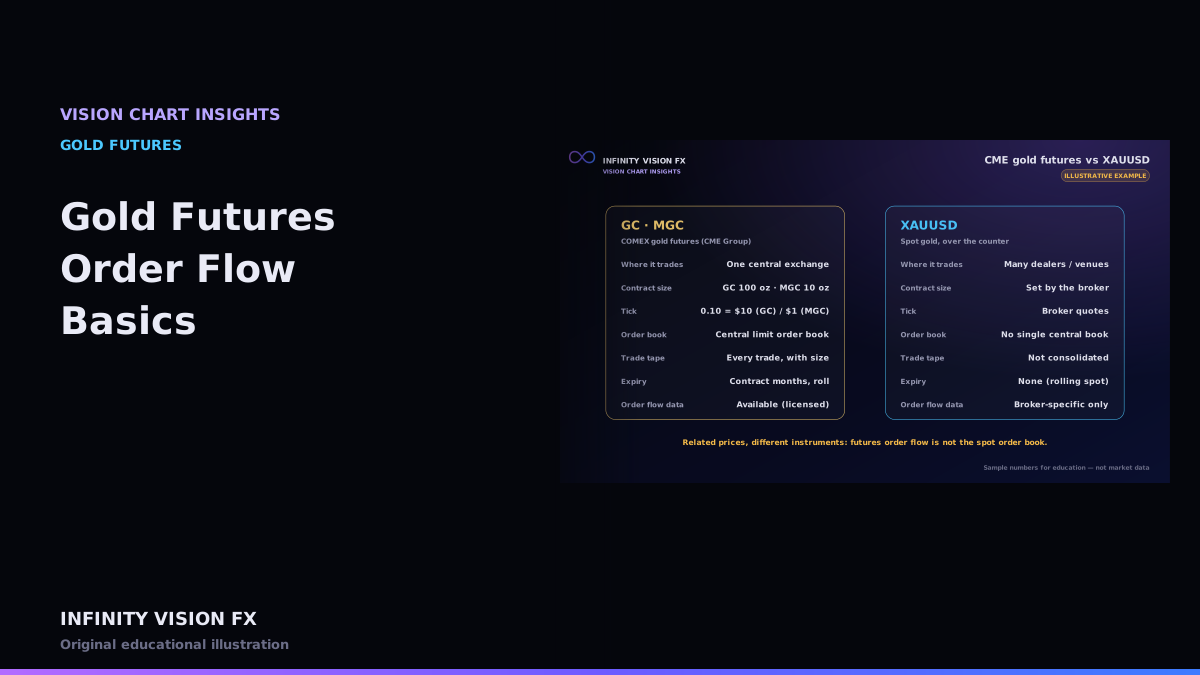
Contract specifications, ticks, sessions and rollover for COMEX gold — the practical basics before reading gold order flow.
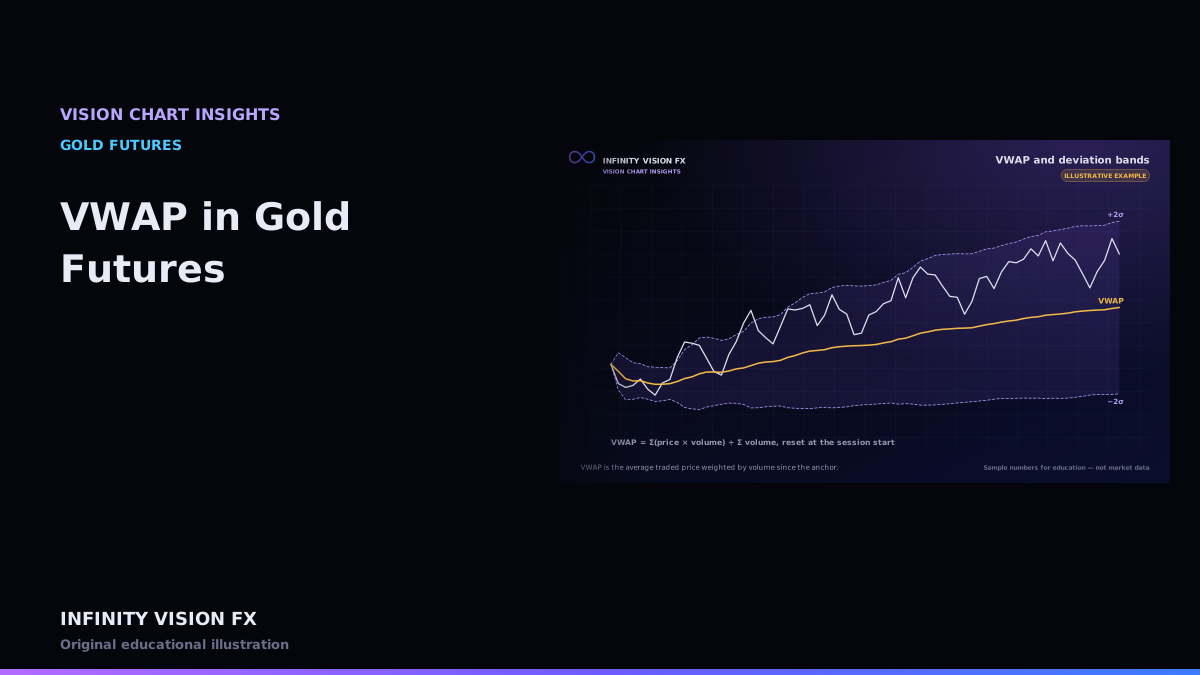
How VWAP is calculated for COMEX gold, which session boundaries apply, and how deviation bands are built.
Practice
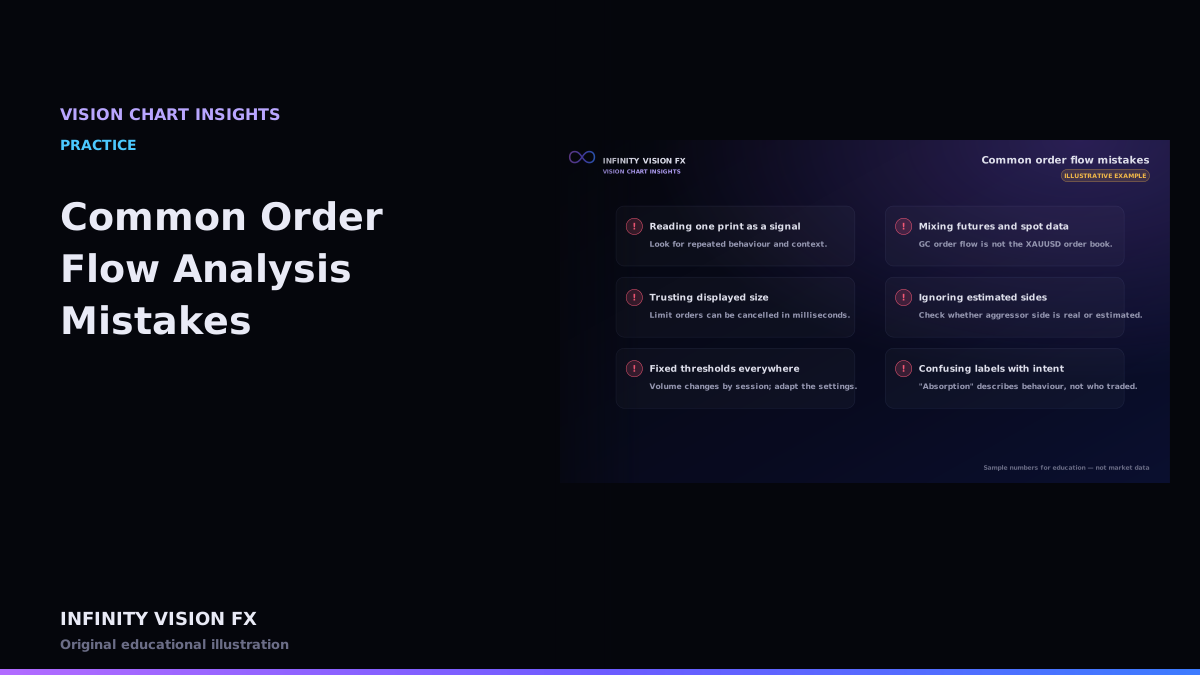
Six mistakes that make order flow analysis misleading, and how VISION CHART helps you avoid them.
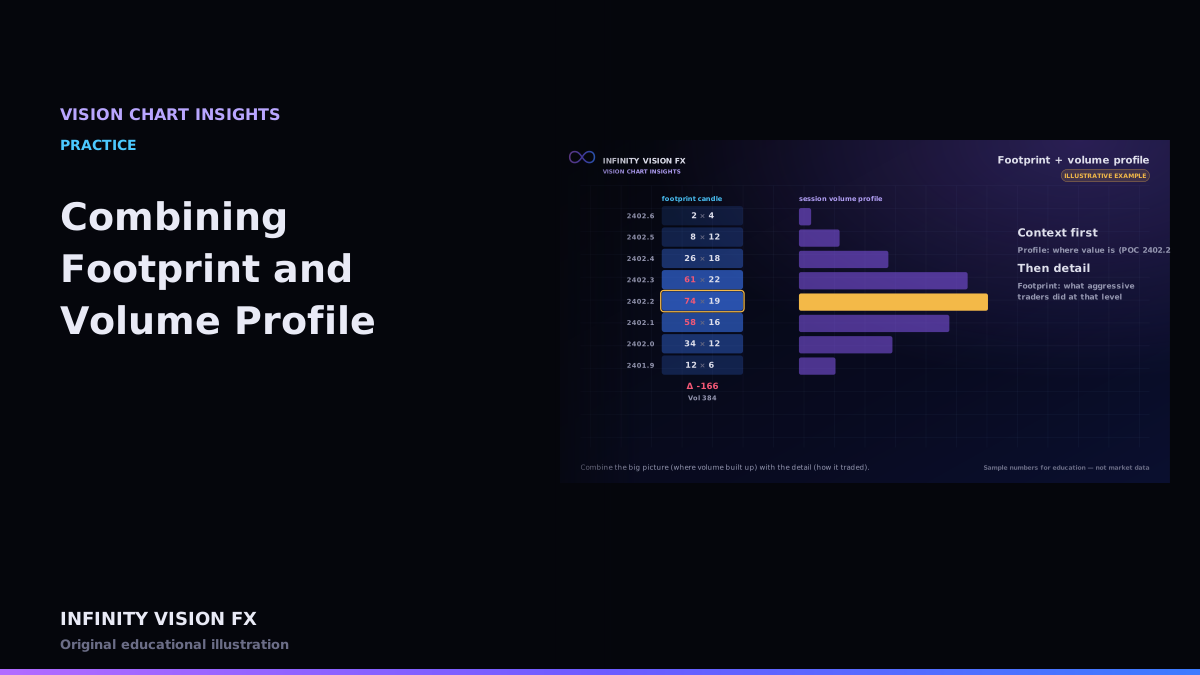
A structured way to combine the big picture of a volume profile with the detail of footprint candles.
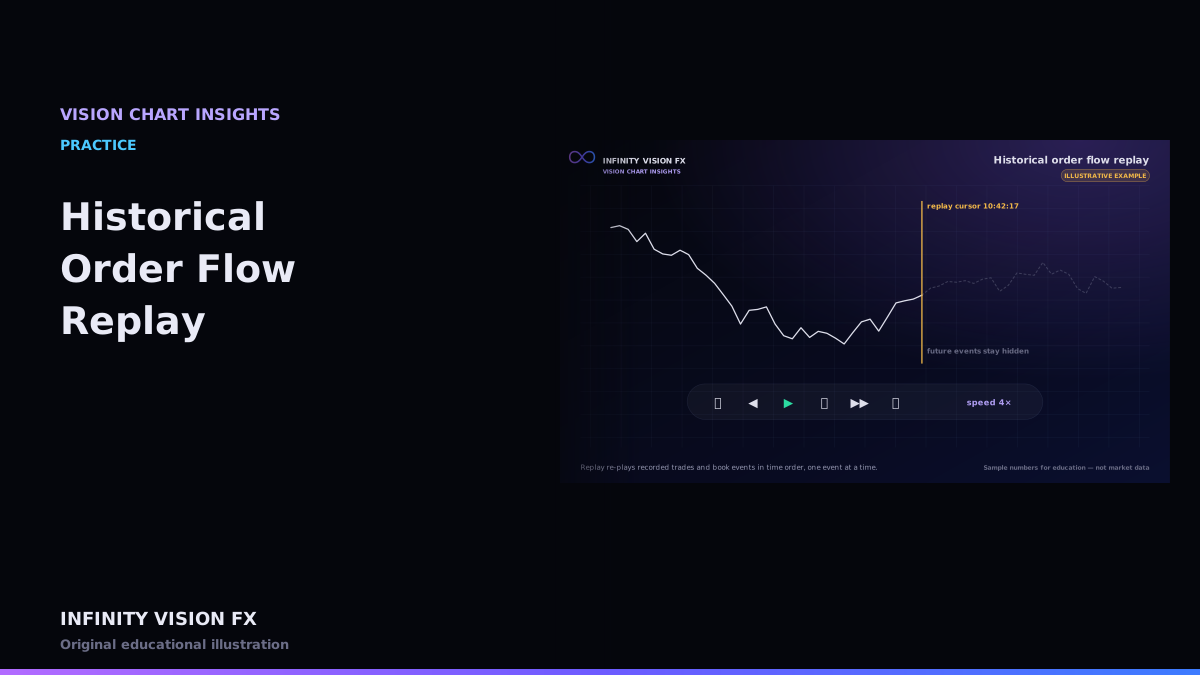
How event-by-event replay works, why it must hide future data, and how to practise with it.