Understanding Iceberg Orders
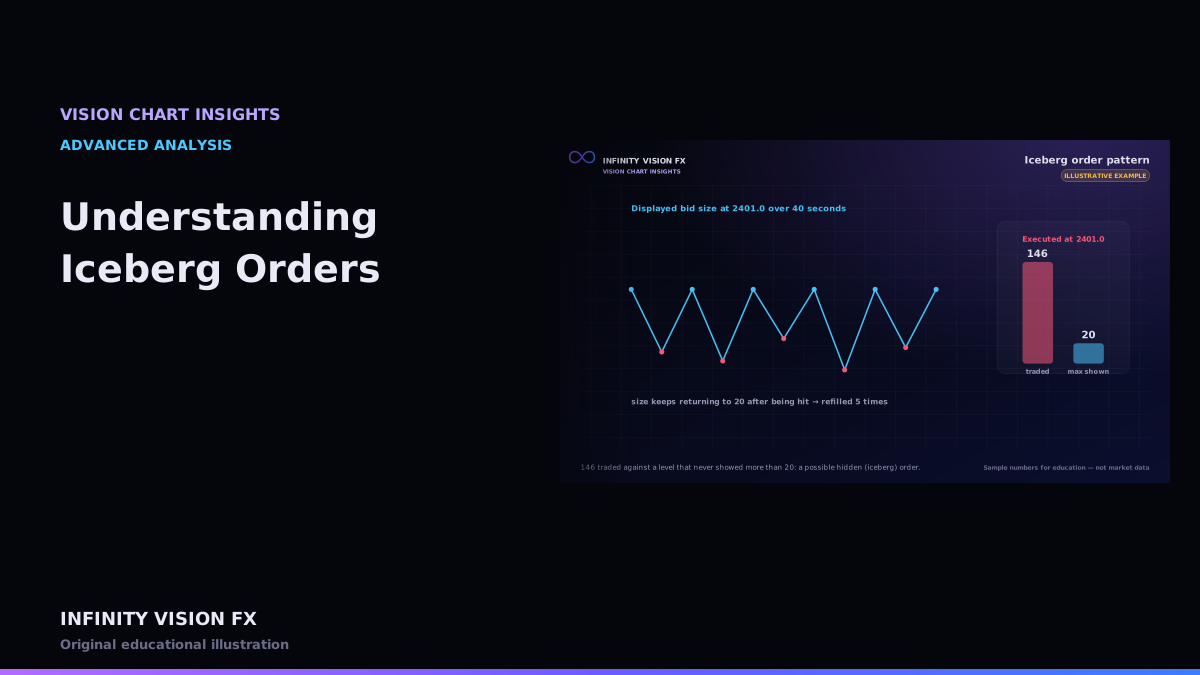
An iceberg order shows only a small "tip" in the order book. When that visible part is filled, another slice appears automatically at the same price, until the full hidden size is used up.
Why use an iceberg?
Large participants may want to avoid showing their full size, because a huge visible order can change how others behave. Many exchanges support native iceberg functionality; others see the same effect from algorithms that keep re-entering orders.
The detectable pattern
VISION CHART looks for episodes at a single price where:
- The displayed size is reduced and then refilled at least a set number of times (default 3);
- The volume executed at that price during the episode is at least a set multiple (default 3×) of the largest size ever displayed there.
Every detection reports the executed volume, the maximum displayed size, the number of refills and the duration.
Data requirements
Iceberg analysis needs granular depth updates and trade prints with aggressor side, time-aligned. Market-by-Order data makes it more reliable. Without that data, VISION CHART shows:
Limitations
- Several ordinary orders at one price can look like an iceberg.
- Fast markets and conflated feeds can hide refills.
- Detection is always "potential hidden liquidity", never a confirmed order.
A worked example (illustrative)
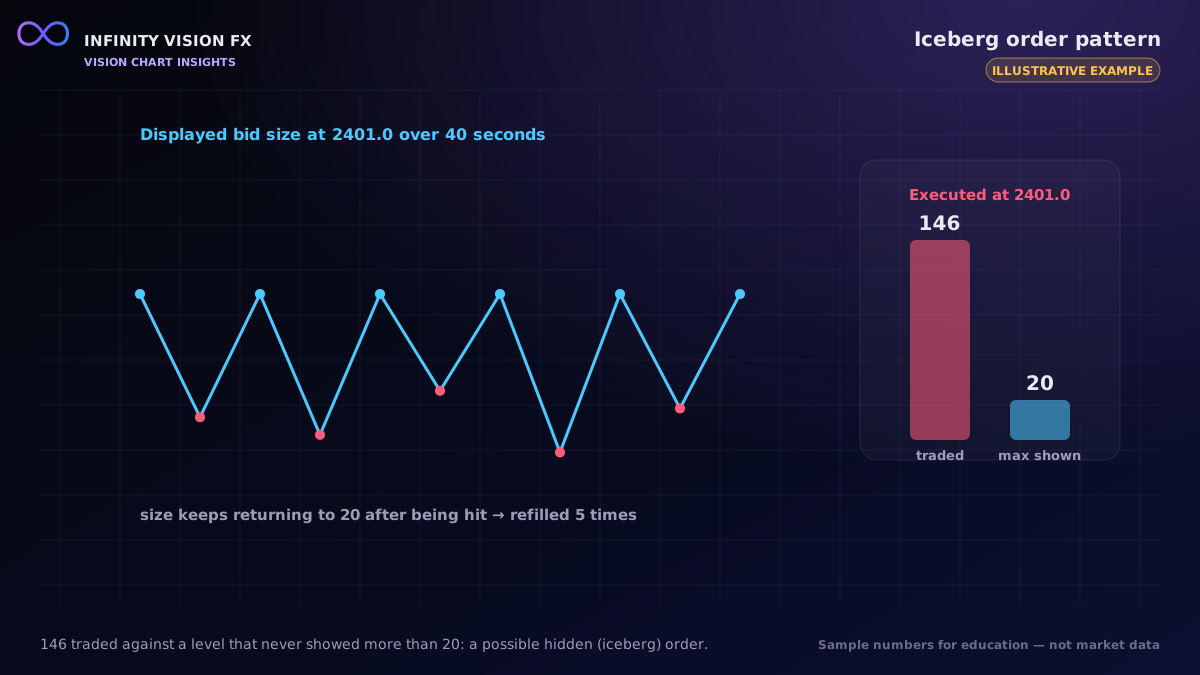
At 2401.0 the bid shows 20 contracts. Over 40 seconds:
- Sellers hit the bid; displayed size drops to 6, then refills to 20.
- This repeats five times, each time back to about 20.
- Total sell-aggressor volume at 2401.0 during the episode: 146 contracts.
- No trade happens below 2401.0 during the episode.
Executed (146) ÷ largest displayed (20) = 7.3. Refills at a consistent size, executions far above the displayed size and a level that held: VISION CHART would report potential hidden liquidity with these numbers.
Why "potential"?
Several independent traders refreshing orders at one price can produce the same footprint as a single iceberg. A market maker quoting continuously can too. The data shows hidden size was available; it does not prove a single order or a single participant.
Data requirements
Granular, time-aligned depth updates and trades with aggressor side. With conflated data (book updates merged over time), refills can be missed, and detection becomes unreliable.
Key takeaways
- Icebergs display only part of their size and refill.
- Detection compares executed vs displayed volume over an episode.
- It needs detailed depth and trade data; without it, no detection is shown.
Next article: Big Trades and Market Activity
Educational content only, not financial advice. Examples and illustrations use sample numbers and are not observations of real market activity. Order flow describes past and present activity; it does not predict prices.