Big Trades and Market Activity
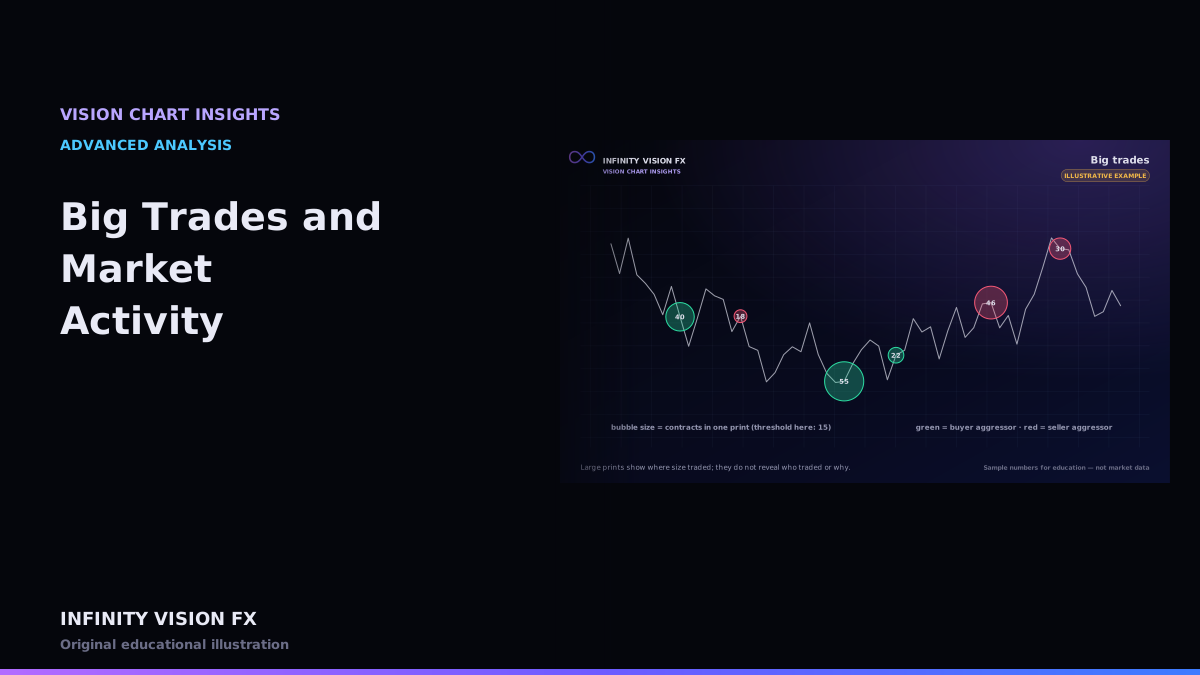
Large trades stand out on the tape and on charts as bubbles. They are worth noticing, but easy to over-interpret.
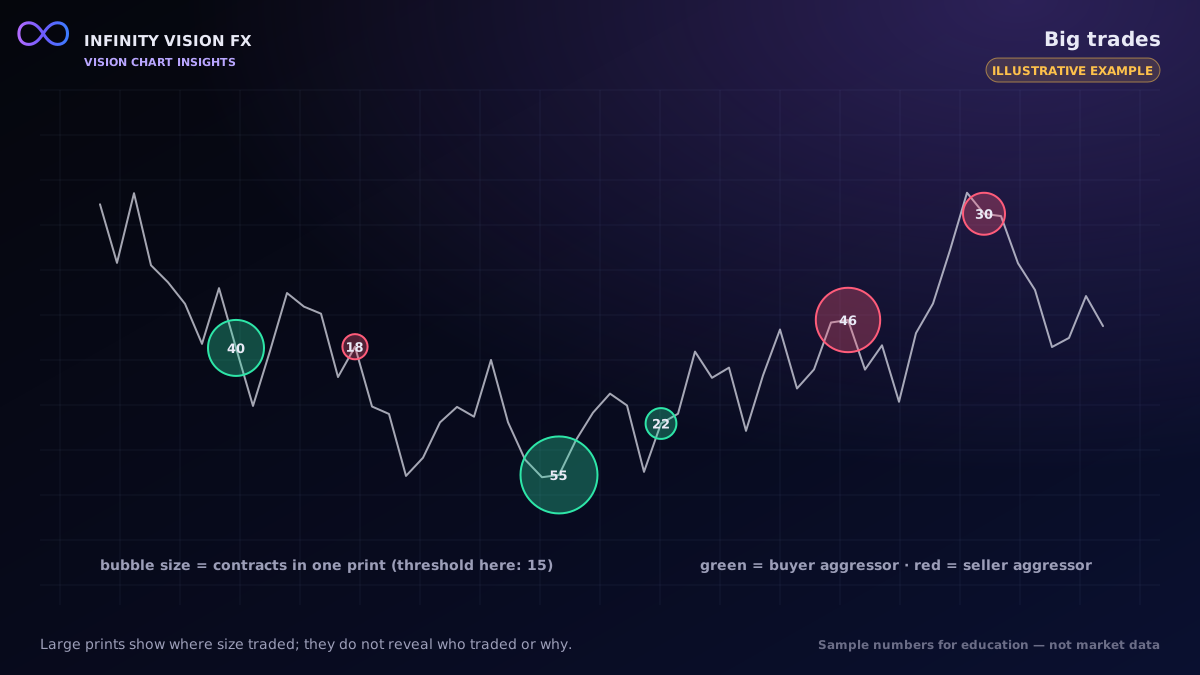
How VISION CHART finds them
- Threshold — a print at or above a size you choose (for example 20 GC contracts) is "big". You can set it per instrument because MGC contracts are one-tenth the size of GC.
- Clustering — prints on the same side, within a short time window and a few ticks, are grouped. Large orders are often split into several prints, so a cluster can be more meaningful than one print.
- History and alerts — the Big Trades panel keeps a history and can alert without flooding (duplicates are suppressed).
Reading big trades
- Big prints at a level that then holds can show where size was willing to trade.
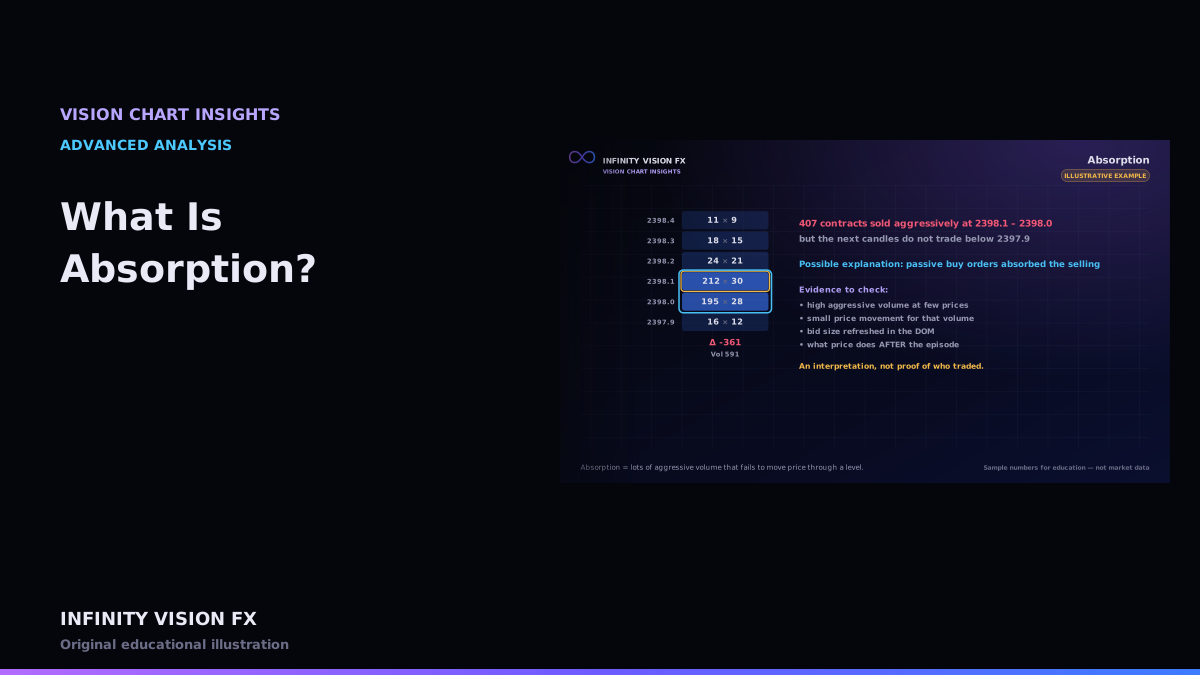
- Big aggressive prints that fail to move price can be part of an absorption story.
- A big print in a thin overnight market means something different from the same size in the New York open.
What big trades do not tell you
- Who traded: a single bank, a fund, a market maker hedging, or a spread leg.
- Why: closing a position looks identical to opening one.
Choosing a threshold
A fixed number such as 20 GC contracts is easy to understand, but the meaning changes with activity: during the New York morning many prints are large; overnight, a 20-lot is rare. Two approaches:
- Fixed size — simple and comparable across days.
- Relative size — a print in the top 1 % of sizes for the session.
Remember that 1 GC contract equals 10 MGC contracts in gold exposure; thresholds should differ between the two.
Reading prints in context (illustrative)
A cluster of 140 contracts bought at the ask over two seconds, right at the session's value area high, followed by price stalling, is an observation worth noting. The same cluster in the middle of a quiet range may mean nothing. Context — location, time and what follows — gives prints meaning.
Limitations
- Exchanges and vendors may split one order into many prints or combine prints differently.
- Block trades and spread trades can appear on the tape without directional intent.
Key takeaways
- Big trades are prints above a threshold; clusters group split orders.
- Context (time of day, level, follow-through) gives them meaning.
- Size never identifies the participant.
Next article: Understanding Order Book Imbalance
Educational content only, not financial advice. Examples and illustrations use sample numbers and are not observations of real market activity. Order flow describes past and present activity; it does not predict prices.