What Is Absorption?
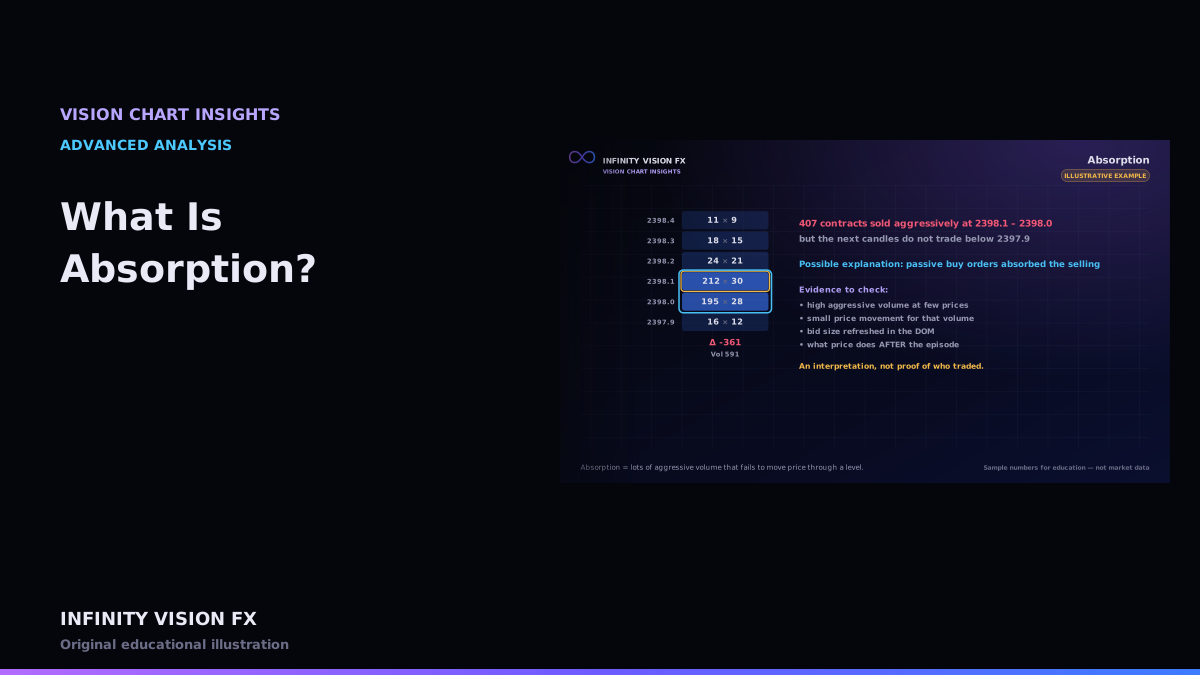
Absorption is the order flow term for a situation where a lot of aggressive volume hits a price, yet price does not move through it. The usual explanation is that passive limit orders on the other side were large enough to take — "absorb" — the aggression.
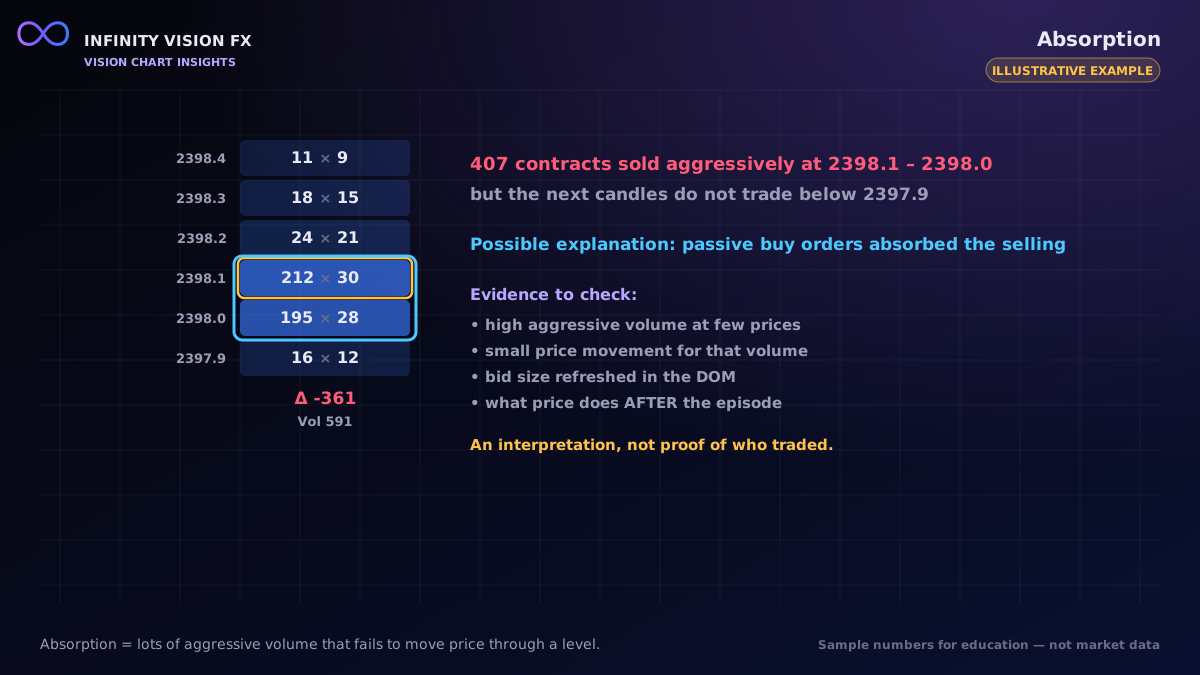
The evidence
VISION CHART flags potential absorption only when several conditions appear together:
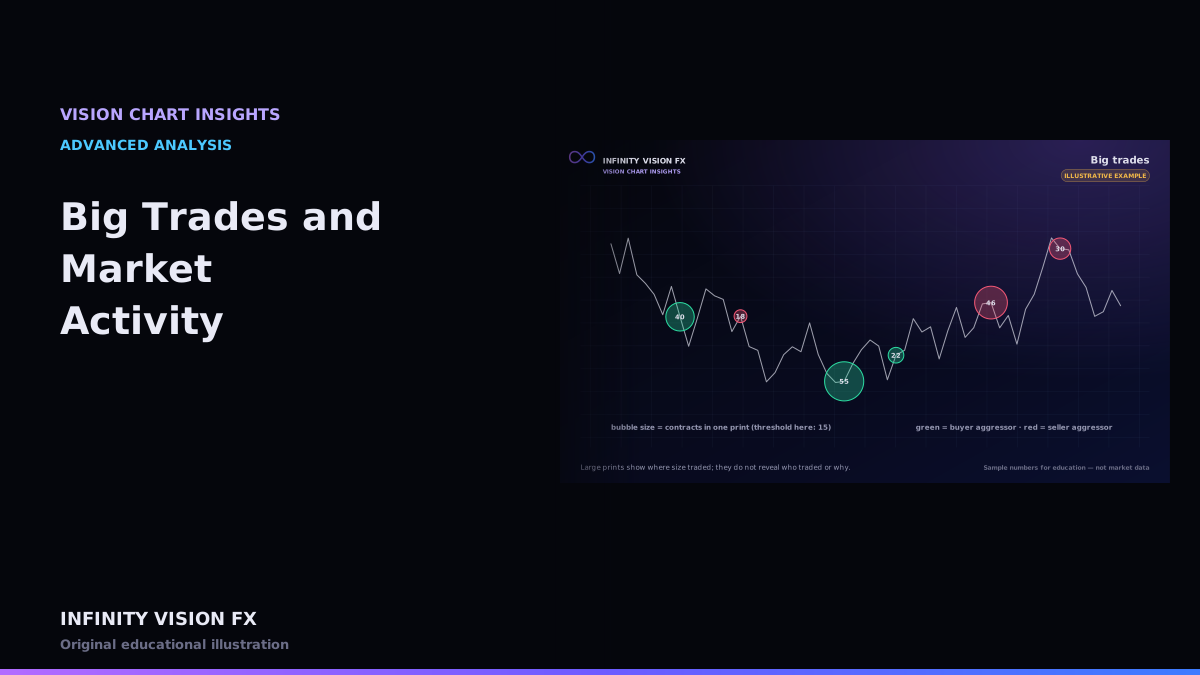
- High aggressive volume on one side within a bar (above a minimum you set).
- Concentration — a large share of that volume at just a few price levels.
- Limited price movement — the bar's range stays within a small number of ticks.
- No follow-through — the bar does not close in the aggressor's direction.
Each flag lists the numbers behind it, so you can judge it yourself.
Supporting evidence from the order book
When depth data is available, absorption becomes more convincing if:
- the bid (for selling absorption) keeps being refreshed as it is hit;
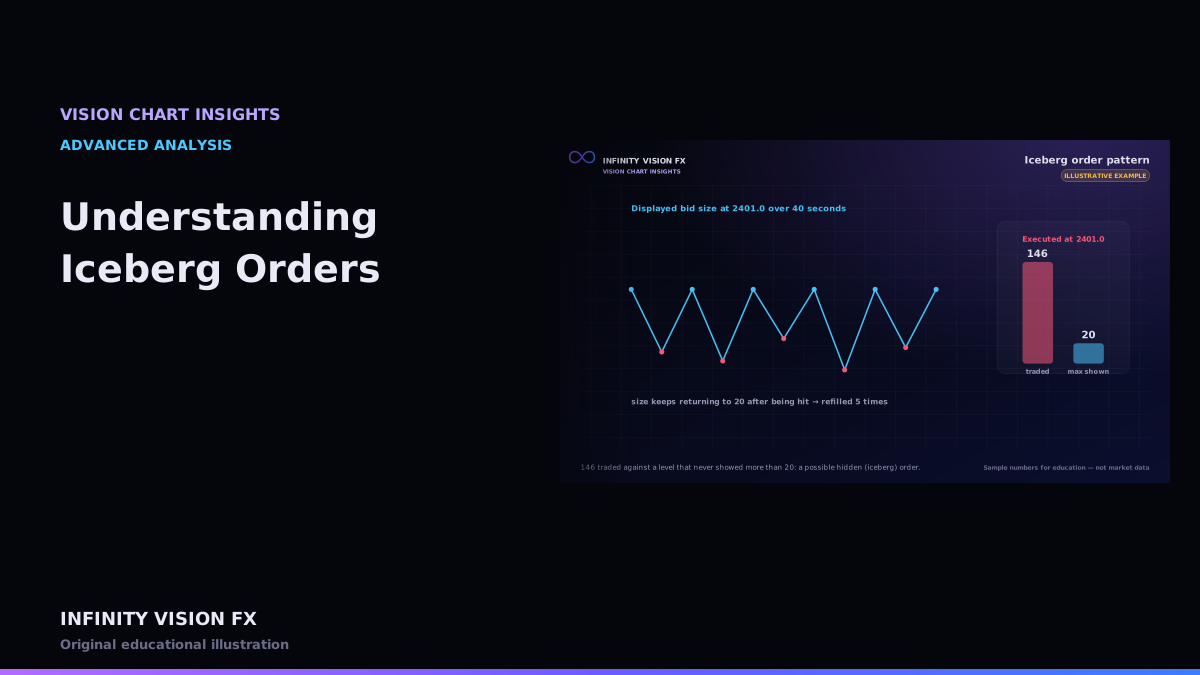
- displayed size at the level stays roughly constant despite trades;
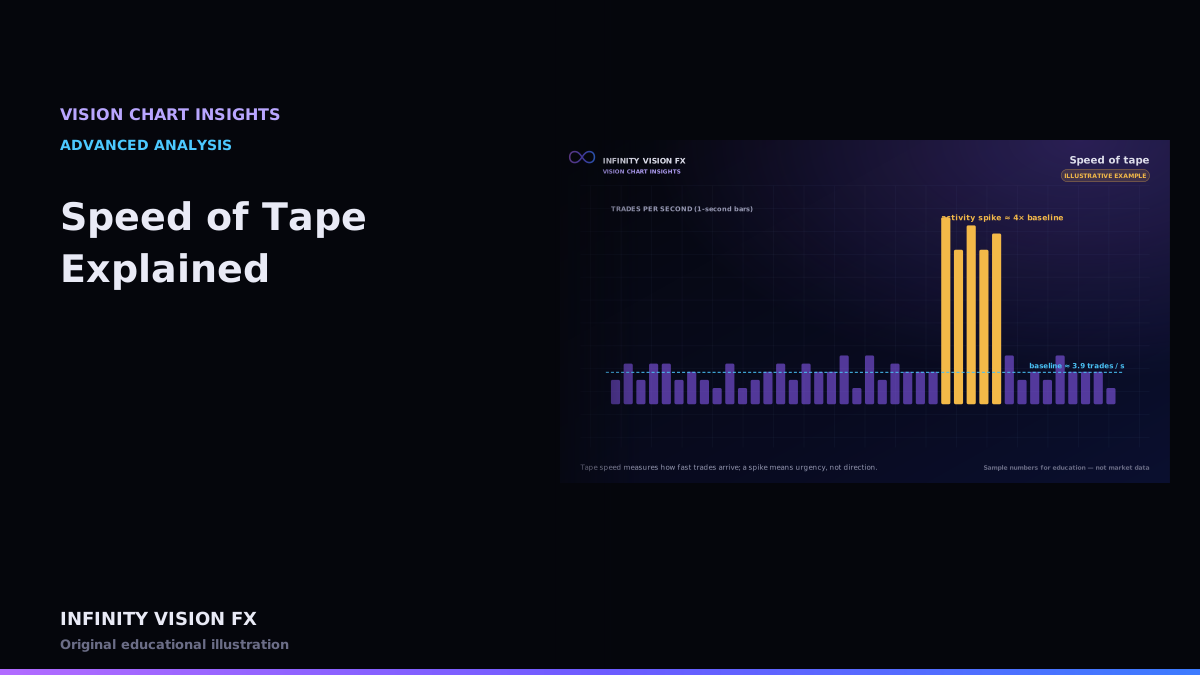
- the tape slows after the episode.
Why it stays an interpretation
The same footprint can come from different causes: a large passive buyer, many small buyers, an iceberg order, or simply sellers running out. Absorption describes behaviour; it does not identify a participant.
Practical use (illustrative)
A trader studying a pullback into a prior value area might note potential bid-side absorption at the value-area low, then watch whether price holds the level in the next candles. The absorption is one piece of context, not the decision.
Separating absorption from exhaustion
Both can show heavy aggression with little price movement, but they differ in what happens next:
- Absorption — passive orders keep taking the aggression; the level holds while aggression continues.
- Exhaustion — aggression simply fades; volume drops and price stalls because fewer participants are pushing.
Checking the tape speed and the DOM during the episode helps tell them apart: absorption usually shows continued high activity and refreshed resting size; exhaustion shows activity slowing down.
Thresholds to set
- Minimum aggressive volume per bar — relative to the session's normal volume.
- Maximum range in ticks — what counts as "price did not move".
- Concentration — the share of the volume at the top few levels.
VISION CHART uses defaults (200 contracts, 6 ticks, 50 % at three levels) that you can adjust; quiet overnight sessions usually need lower volume thresholds.
Key takeaways
- Absorption = heavy aggression with little price progress.
- It needs volume concentration, a small range and no follow-through.
- Order book refreshes strengthen the case; nothing proves intent.
Next article: Understanding Iceberg Orders
Educational content only, not financial advice. Examples and illustrations use sample numbers and are not observations of real market activity. Order flow describes past and present activity; it does not predict prices.