Speed of Tape Explained
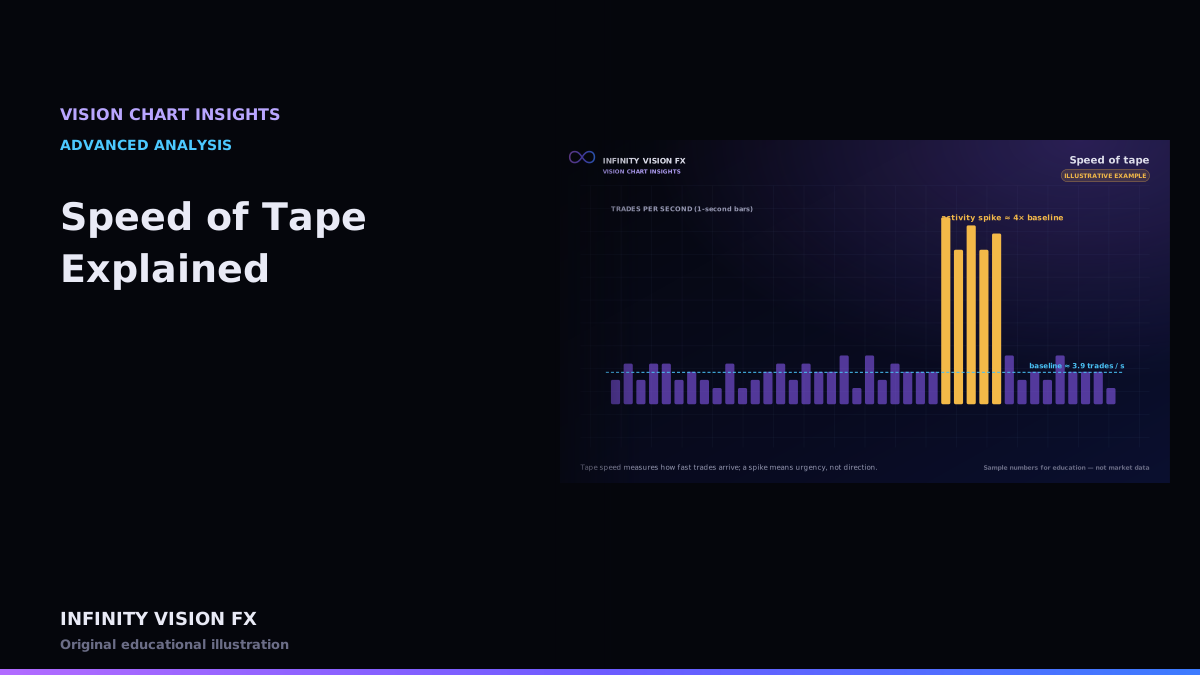
"Reading the tape" originally meant watching every trade print. Speed of tape turns that into numbers: how many trades, and how many contracts, are arriving per second.
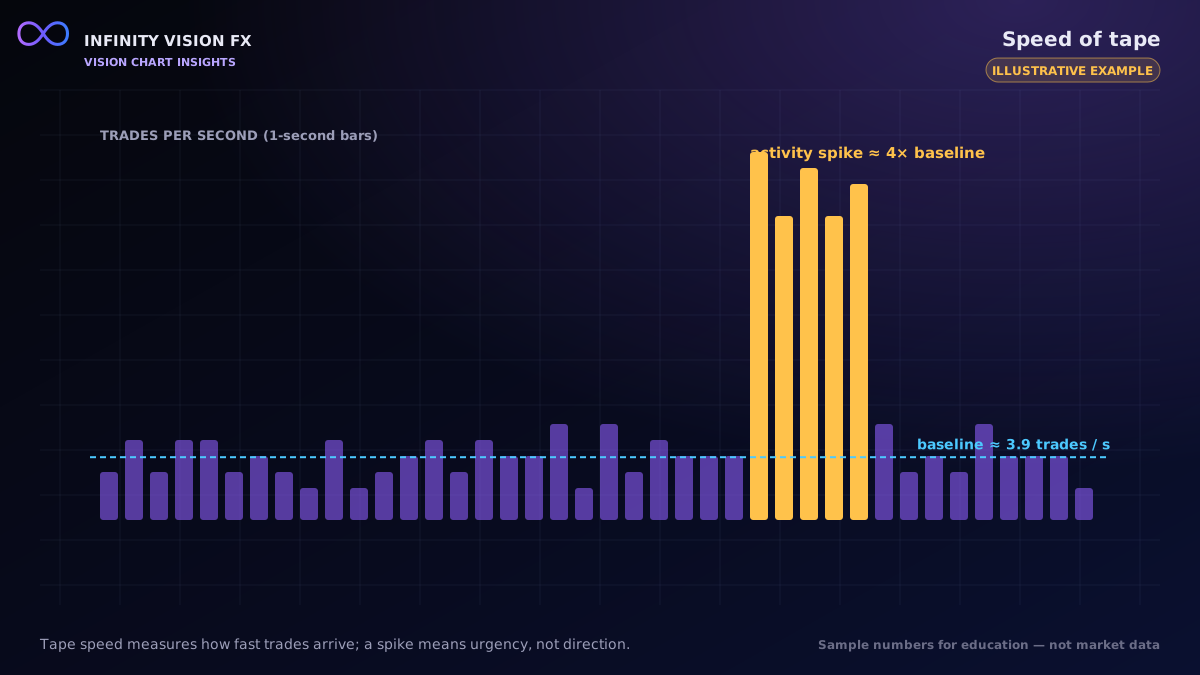
Metrics in VISION CHART
- Trades per second and contracts per second over a window you choose (5, 10, 30 or 60 seconds).
- Baseline — the same metrics over the preceding few minutes.
- Spike — current trades per second at least 2.5× the baseline.
- Acceleration — volume in the second half of the window vs the first half.
- Aggressive buy share — the share of window volume that was buy-aggressor.
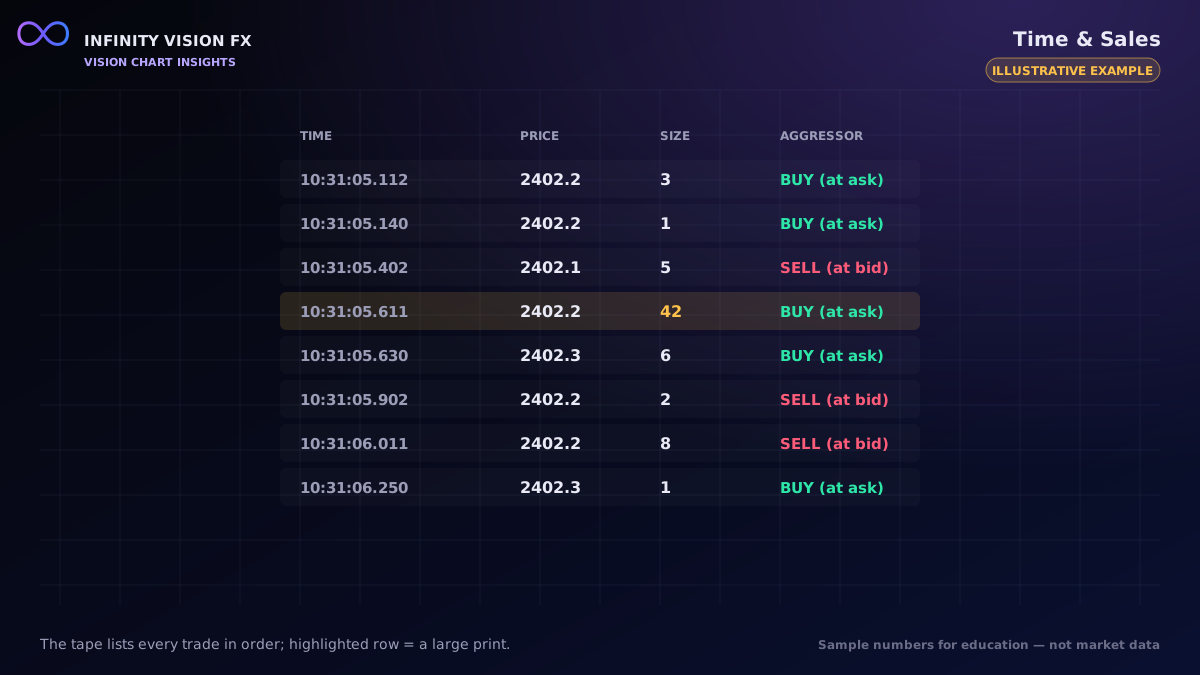
Interpreting speed
Fast tape means urgency — many participants acting at once — but not direction. Spikes appear around economic releases, the open of major sessions, and when stops are triggered. A spike with strongly one-sided aggression and price progress says more than a spike with balanced aggression and no progress.
Limitations
- Exchange feeds may batch trades, especially at peaks, which changes measured speed.
- Speed comparisons only make sense within similar sessions.
A worked example (illustrative)
Over the last five minutes the market averaged 2.8 trades per second. In the most recent 10 seconds, 34 trades arrived: 3.4 per second — 1.2× the baseline, no spike. Then, around an economic release, 112 trades arrive in 10 seconds: 11.2 per second, 4× the baseline. VISION CHART flags that as a spike and shows the aggressive buy share for the same window.
Acceleration
VISION CHART also compares the second half of the window with the first. An acceleration of 2× means contracts per second doubled within the window — activity is building right now, not just higher than earlier.
Using it carefully
- Compare speeds within the same session type; the Asian session is naturally slower.
- A spike shows urgency. Combine it with delta and price progress to understand who was urgent and whether it moved price.
Key takeaways
- Tape speed = trades and contracts per unit of time.
- Compare against a recent baseline to find spikes.
- Speed shows urgency, not direction.
Next article: VWAP in Gold Futures
Educational content only, not financial advice. Examples and illustrations use sample numbers and are not observations of real market activity. Order flow describes past and present activity; it does not predict prices.