Understanding Market Delta
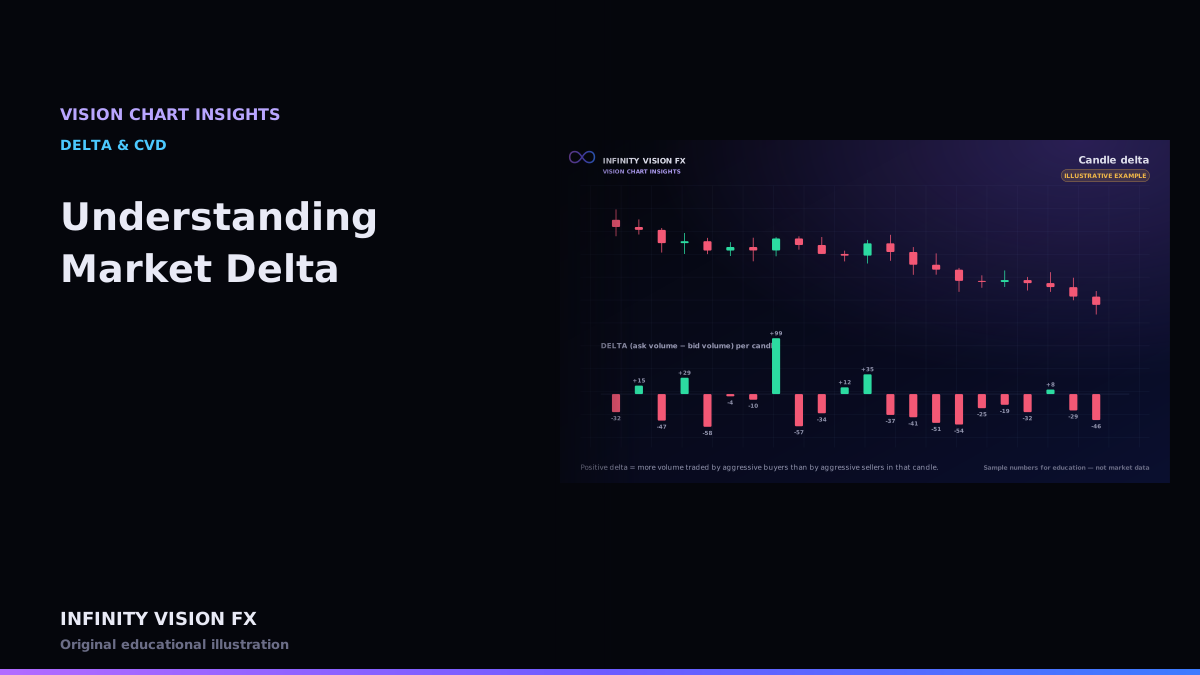
Delta condenses a candle's order flow into one number: how much more volume traded at the ask than at the bid.
The calculation
Delta = ask volume − bid volume
It can be computed per price level, per candle, per session or over any custom range. VISION CHART also shows delta %:
Delta % = delta ÷ total volume × 100
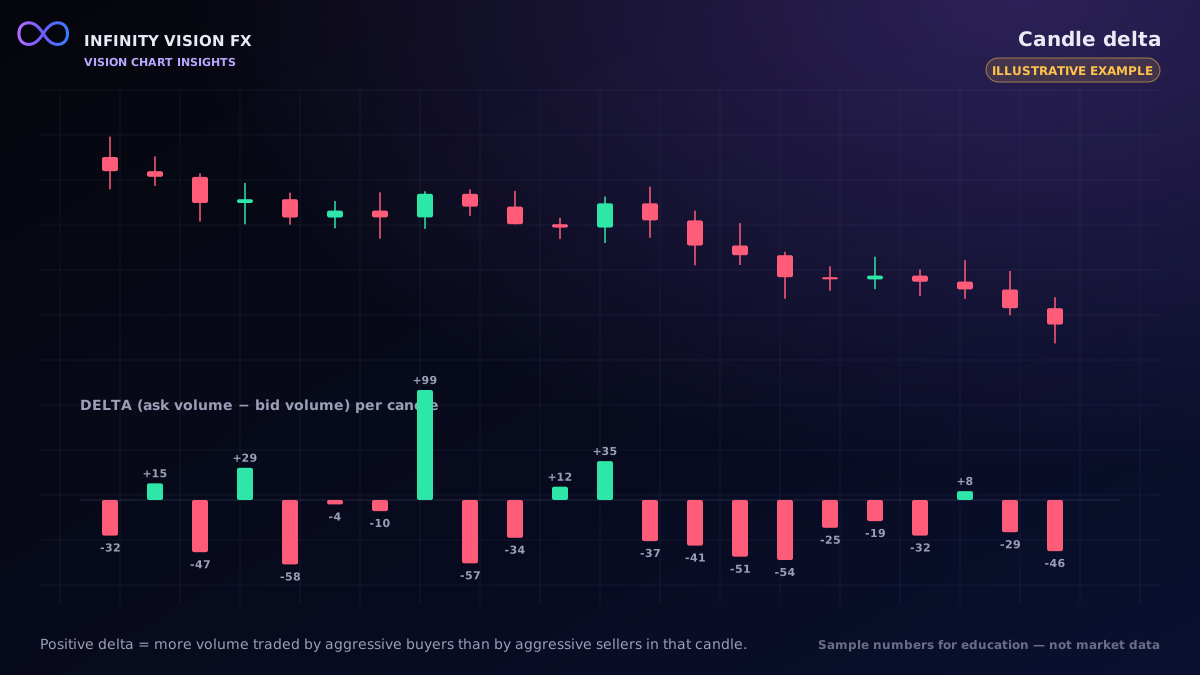
Interactive example: open this article on the Infinity Vision FX website to use it.
Reading delta in context
- A strong up candle with strongly positive delta shows aggressive buyers drove the move.
- An up candle with negative delta is more unusual: price rose while sellers were the aggressors. That can happen when buy limit orders are lifted from below, or when sellers are being absorbed.
- Delta near zero on a large range candle means aggression was balanced; price moved for other reasons (for example, liquidity being pulled).
Delta momentum
VISION CHART's delta momentum compares the recent average of delta with the previous one. Rising momentum means aggression is building in one direction; falling momentum means it is fading.
Limitations
- Delta depends on correct aggressor classification. Estimated sides weaken it.
- Delta ignores passive orders, which often decide whether a move continues.
- Session volume differs (Asian hours vs New York hours), so the same delta value means different things at different times.
A worked example (illustrative)
Take three five-minute candles in a quiet session:
| Candle | Ask volume | Bid volume | Delta | Delta % |
|---|---|---|---|---|
| 1 | 420 | 300 | +120 | +16.7 % |
| 2 | 150 | 390 | −240 | −44.4 % |
| 3 | 310 | 290 | +20 | +3.3 % |
Candle 2 stands out: aggressive selling was more than twice aggressive buying. If price barely fell during that candle, a trader might start asking whether passive buyers were absorbing the selling. If price fell hard, the delta simply confirms who drove the move.
Delta at price vs candle delta
Delta can also be shown for each price level inside a candle. A candle with a positive total delta can still contain prices where sellers dominated — often at the high, where late buyers met resting sell orders. Reading both levels together tells you where inside the candle each side was active.
Data requirements
- Trade-by-trade data with aggressor side (best) or a documented estimation rule.
- Consistent session boundaries if you compare delta across sessions.
Key takeaways
- Delta = ask volume − bid volume.
- Delta % makes candles of different sizes comparable.
- Disagreement between delta and price is often more informative than agreement.
Next article: Cumulative Volume Delta Explained
Educational content only, not financial advice. Examples and illustrations use sample numbers and are not observations of real market activity. Order flow describes past and present activity; it does not predict prices.