Delta Divergence Explained
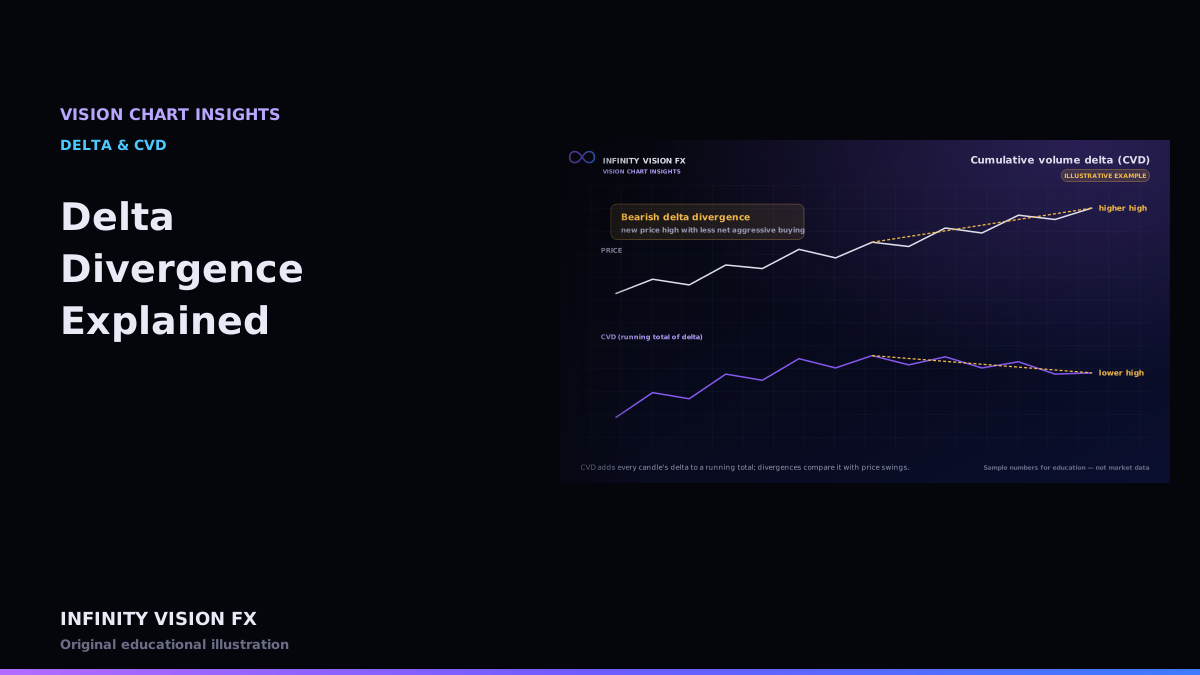
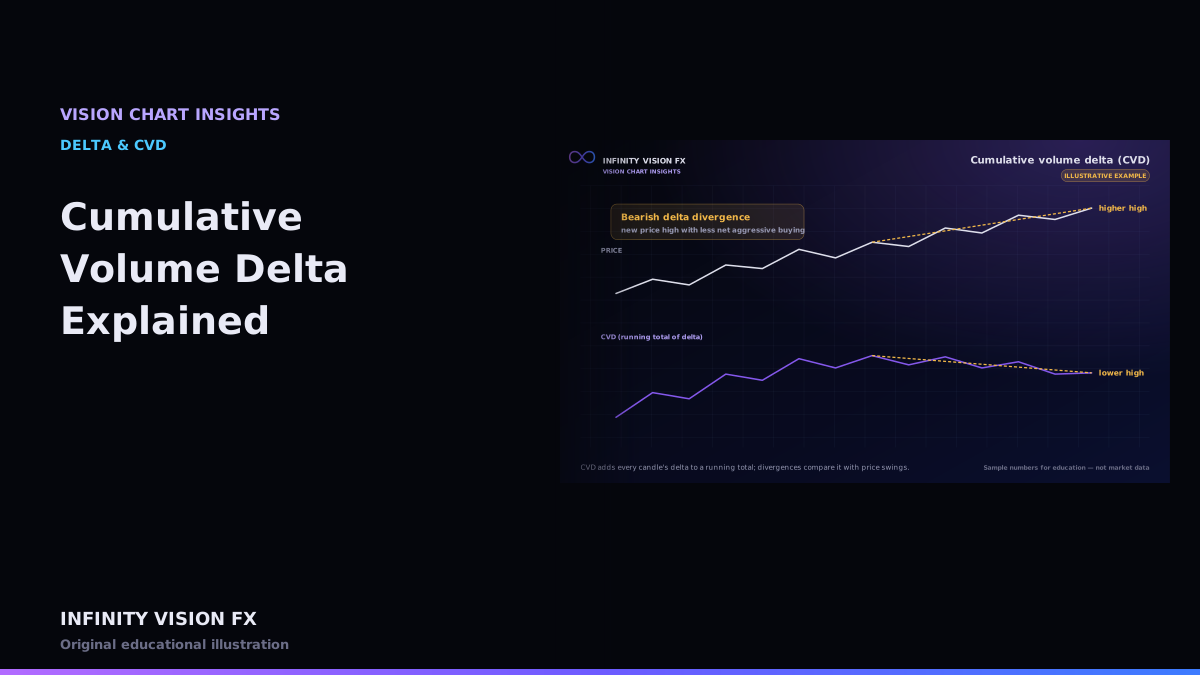
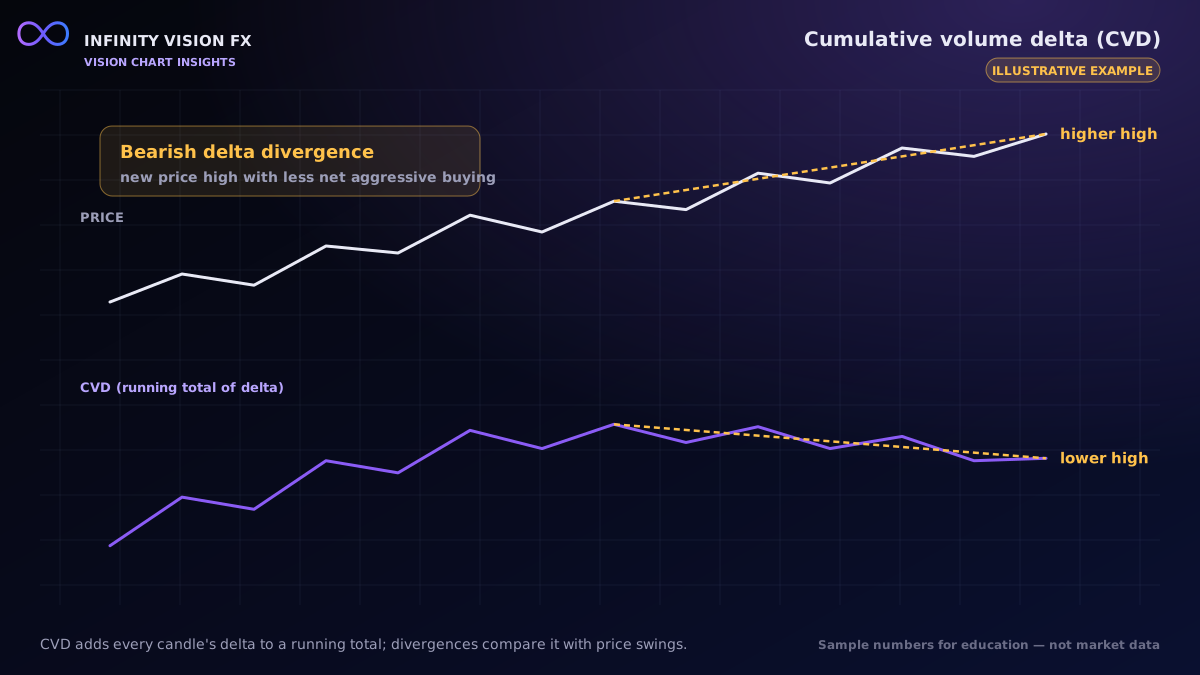
A delta divergence appears when price and delta (or CVD) disagree at swing points.
Definitions
- Bearish divergence — price makes a higher swing high, CVD makes a lower high.
- Bullish divergence — price makes a lower swing low, CVD makes a higher low.
No-lookahead detection
A swing high is only known after a few later candles fail to exceed it. VISION CHART uses swings confirmed after L bars (default 3) and records the divergence at the confirmation time, never earlier. In replay you see it appear exactly when it would have been known.
Interpretation
A divergence says aggressive participation did not keep pace with the new extreme. Possible reasons include passive orders driving price, absorption on the other side, or simply lower activity. It is a warning about strength, not a reversal signal.
Common traps
- Calling divergences on swings that are not yet confirmed.
- Comparing a quiet session's CVD with a busy session's.
- Ignoring the higher-timeframe trend: divergences can repeat many times in a strong trend.
A worked example (illustrative)
| Swing | Price high | CVD at the high |
|---|---|---|
| First swing high | 2405.0 | +1,200 |
| Second swing high | 2406.3 | +850 |
Price made a higher high (+1.3) while CVD made a lower high (−350): a bearish divergence, recorded when the second swing is confirmed — three bars after the high with the default setting.
What can cause it
- Aggressive buyers stepping back while passive orders lift the price.
- Absorption of buying near the high.
- Lower activity overall (for example, a lunch-time drift).
Avoiding hindsight
It is easy to spot divergences on a finished chart and remember only the ones that preceded a turn. Use replay to see divergences at the moment they were confirmed, including the ones after which price kept going.
Key takeaways
- Divergence = price and CVD disagree at confirmed swings.
- It is recorded at confirmation time to avoid lookahead.
- Treat it as information about strength, not a trade instruction.
Next article: Gold Futures Order Flow Basics
Educational content only, not financial advice. Examples and illustrations use sample numbers and are not observations of real market activity. Order flow describes past and present activity; it does not predict prices.