Cumulative Volume Delta Explained
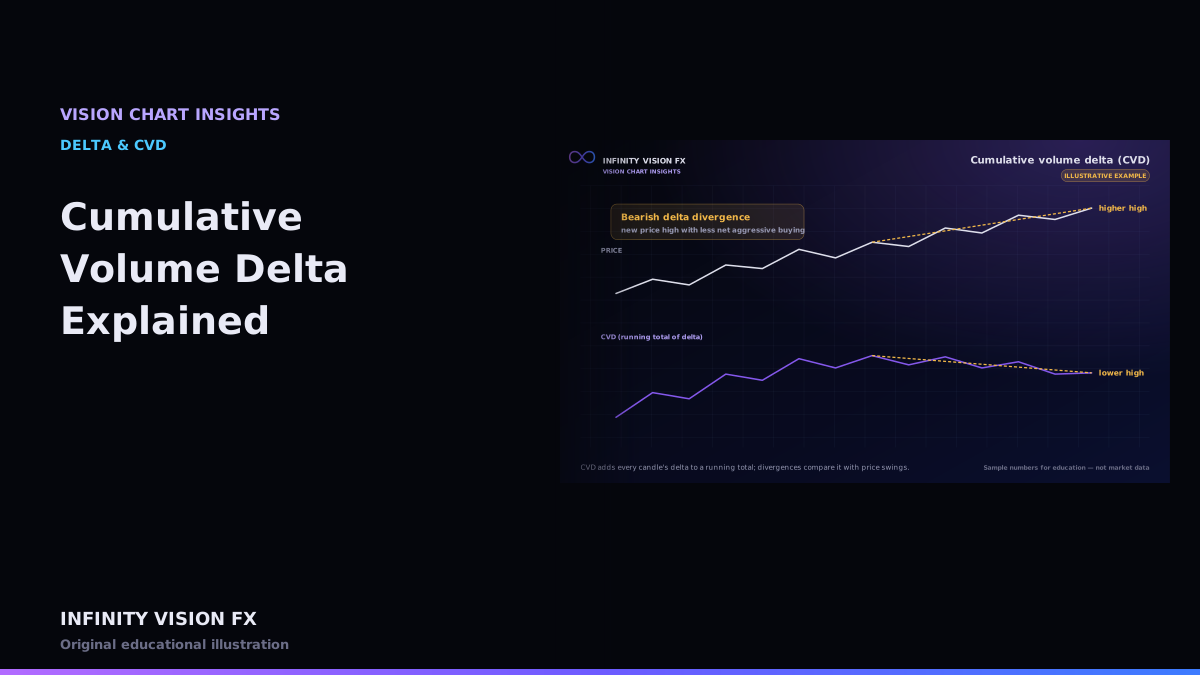
Cumulative volume delta (CVD) adds each candle's delta to a running total. Where delta tells you about one candle, CVD shows how aggression has accumulated over a session or a longer period.
How CVD is built
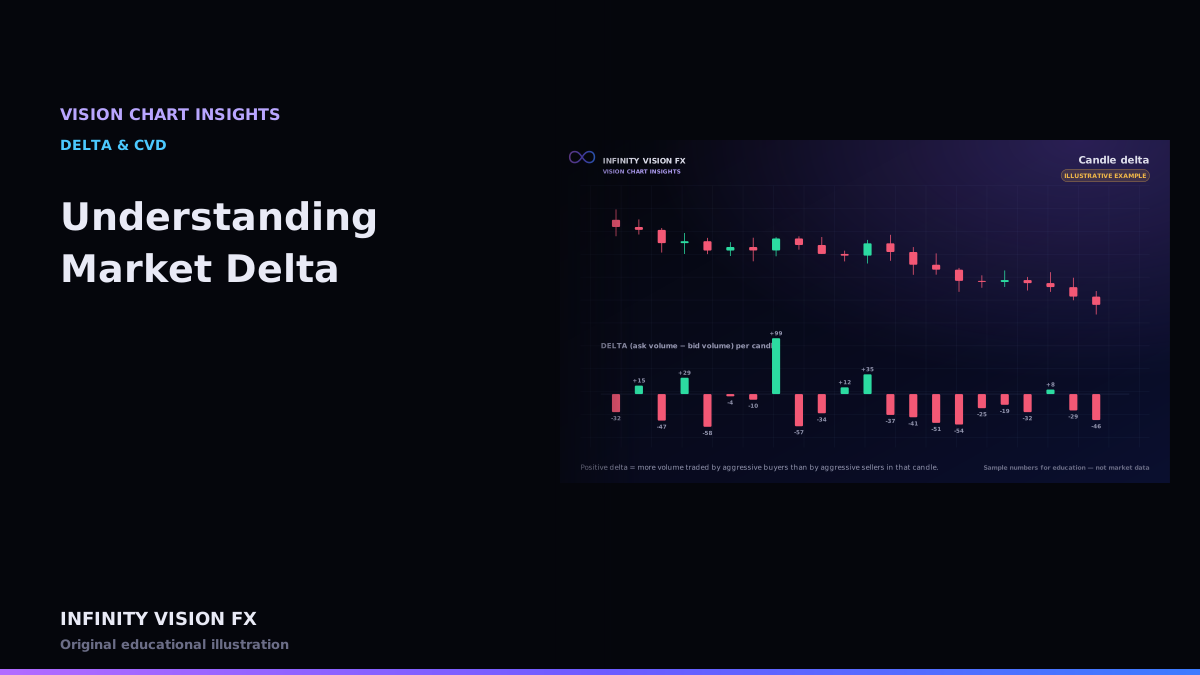
- Calculate delta for each candle (ask volume − bid volume).
- Start from zero at the reset point (for example the start of the CME Globex session at 17:00 Chicago time).
- Add each new candle's delta to the total.
Interactive example: open this article on the Infinity Vision FX website to use it.
Reset choices
- Session reset — CVD starts at zero each trading session. Easy to compare one day with another.
- Continuous — CVD never resets. Useful for longer swings but the number grows without limit.
VISION CHART defaults to a session reset and lets you switch.
Reading CVD against price
- Confirmation — price and CVD make new highs together.
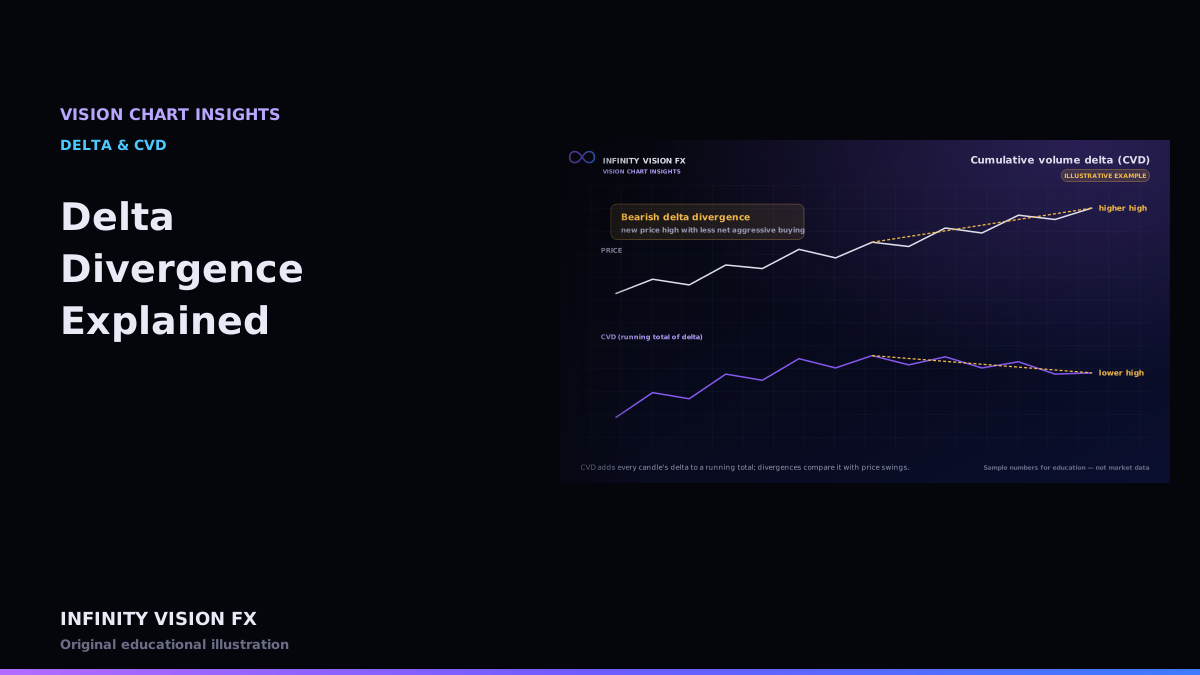
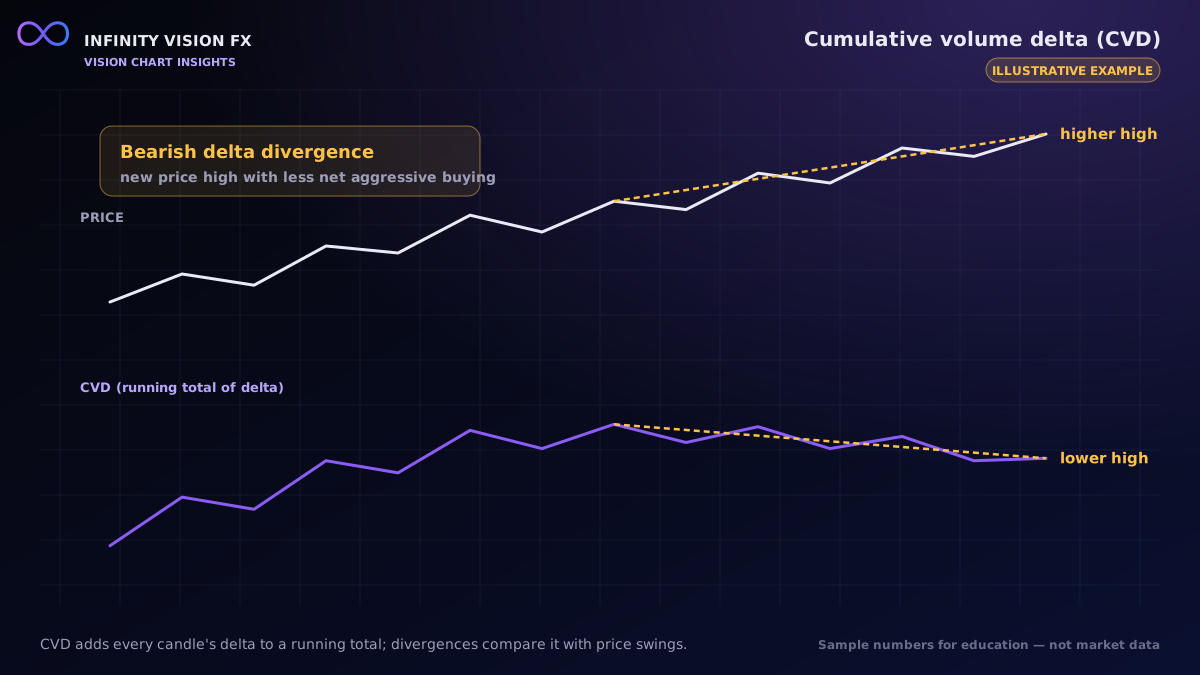
- Divergence — price makes a higher high while CVD makes a lower high (bearish), or price makes a lower low while CVD makes a higher low (bullish).
VISION CHART measures divergences only at confirmed swing points, so a divergence is never drawn before the swing exists. See Delta Divergence Explained.
Limitations
- A divergence says aggression did not keep pace with price; it does not say price must turn.
- CVD inherits every error in aggressor classification.
- Large hedging or spread trades can push CVD without directional intent.
A worked example (illustrative)
| Candle | Delta | CVD |
|---|---|---|
| 1 | +40 | 40 |
| 2 | −10 | 30 |
| 3 | +40 | 70 |
| 4 | −10 | 60 |
| 5 | +25 | 85 |
Price rising from candle 1 to candle 5 while CVD climbs from 40 to 85 tells you the move came with net aggressive buying. If in candle 6 price makes a new high but delta is −30 (CVD falls to 55), CVD did not confirm the new high.
Slope matters more than level
The absolute CVD number depends on the reset point and the session's activity. What usually matters is the slope: is CVD rising, falling or flat while price moves? A flat CVD during a strong price move suggests price moved without one side being clearly more aggressive — for example because liquidity was thin or pulled.
Data requirements
- The same trade data as delta, ideally with exchange-reported aggressor side.
- A clearly defined reset time. VISION CHART shows which reset is active next to the CVD value.
Key takeaways
- CVD is a running total of delta from a chosen reset point.
- Compare CVD with price swings rather than reading its level alone.
- Divergences need confirmed swings and context.
Next article: What Is a Liquidity Heatmap?
Educational content only, not financial advice. Examples and illustrations use sample numbers and are not observations of real market activity. Order flow describes past and present activity; it does not predict prices.