Historical Order Flow Replay
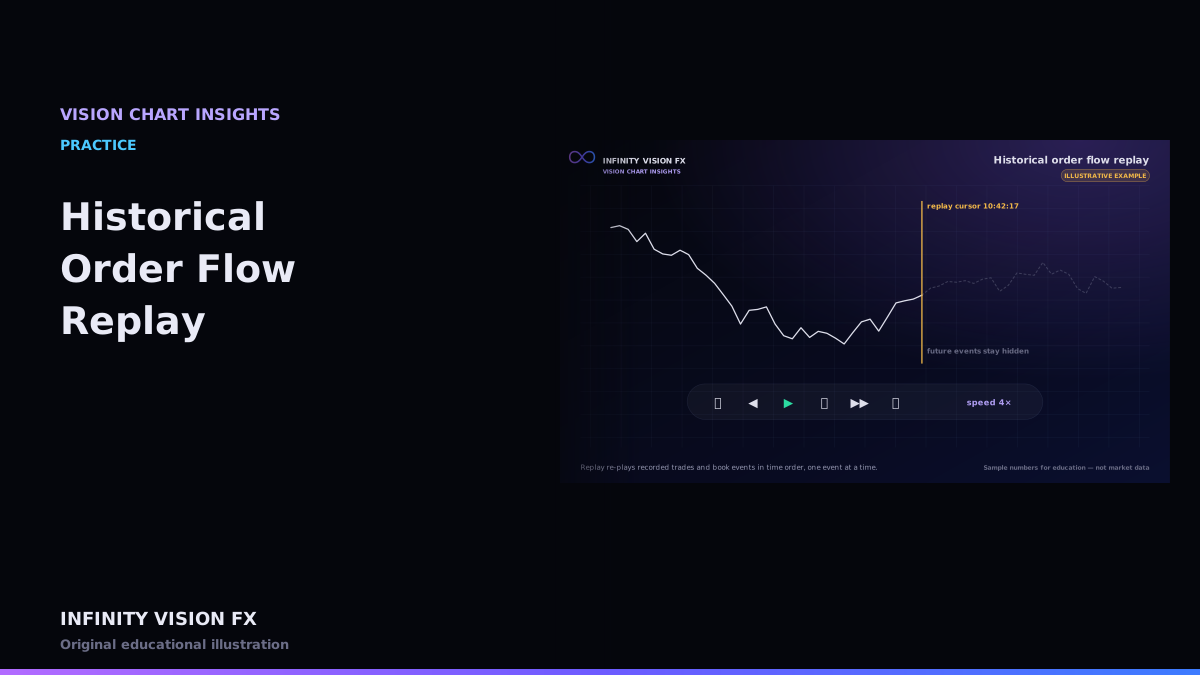
Replay re-plays recorded market events — trades, book snapshots and depth updates — in their original order, so you can study a session as if it were happening.
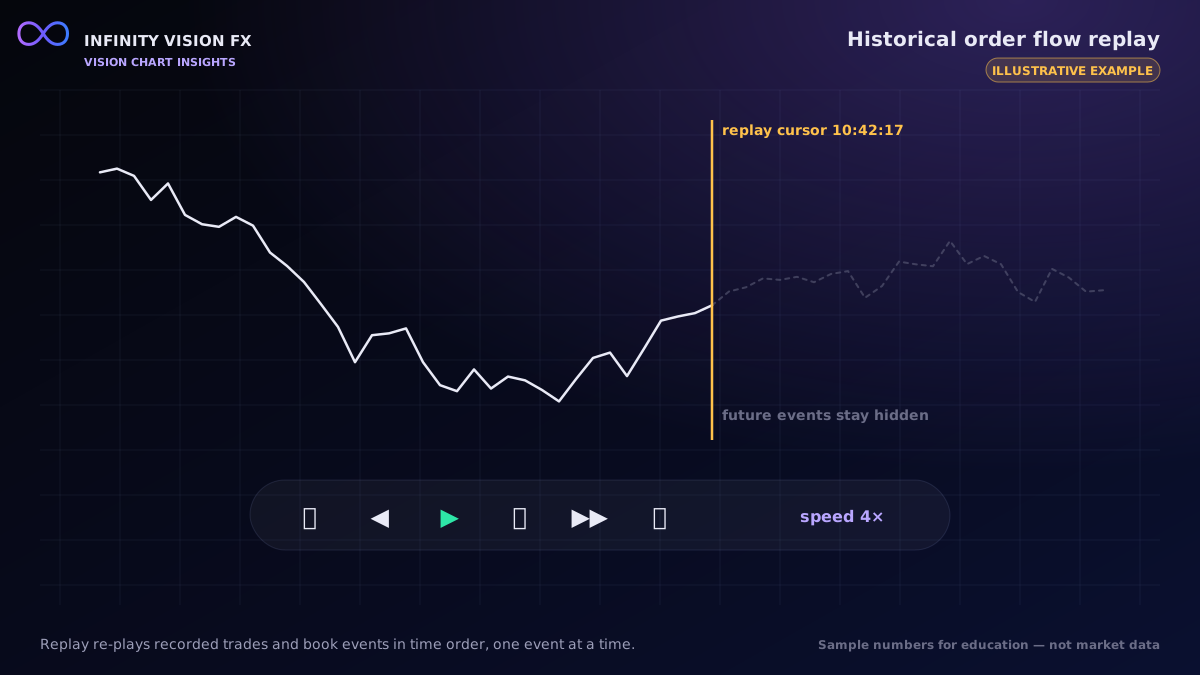
How VISION CHART replays
- Events are sorted by timestamp and sequence number.
- Play, pause, stop, restart, step and speed control the clock.
- Jump to timestamp rebuilds every study from the first event up to that moment — footprint, DOM, heatmap, CVD, profiles and the tape — so nothing after the cursor is used.
- If the recording is missing order-book events, the book is not invented; the replay shows the gap.
Practising with replay
- Pick a session and jump to a point before an interesting move.
- Write down what you see: location vs value area, delta, book imbalance, tape speed.
- Step forward and compare your notes with what happened.
Limitations
Replay shows the data that was recorded. It does not show your own orders' queue position, and it cannot know how the market would have reacted to your trades.
A practice routine (illustrative)
- Choose a session with a clear move, and jump to 15 minutes before it.
- Note four things: price vs session value area, CVD slope, book imbalance, and tape speed.
- Write one sentence: "If X happens, I would consider my reading wrong."
- Step forward one minute at a time. At each step, update your notes before looking further.
- After the move, compare your notes with what happened — including the cases you got wrong.
Speed control
Replay at 1× shows the real pace; 10× or 30× is useful for skimming. Step-by-step mode advances one second of market time per click, which is often enough to see individual large prints and book changes.
Data requirements
Recorded trades and depth events with timestamps and sequence numbers. A replay is only as complete as the recording: if the vendor's history does not include depth, the heatmap and DOM cannot be replayed, and VISION CHART says so.
Key takeaways
- Replay plays recorded events in order; studies use only past events.
- Jumping rebuilds state from the start to prevent lookahead.
- Use it to practise observation, not to prove a strategy.
Next article: Understanding Liquidity Changes
Educational content only, not financial advice. Examples and illustrations use sample numbers and are not observations of real market activity. Order flow describes past and present activity; it does not predict prices.