Understanding Market Profile
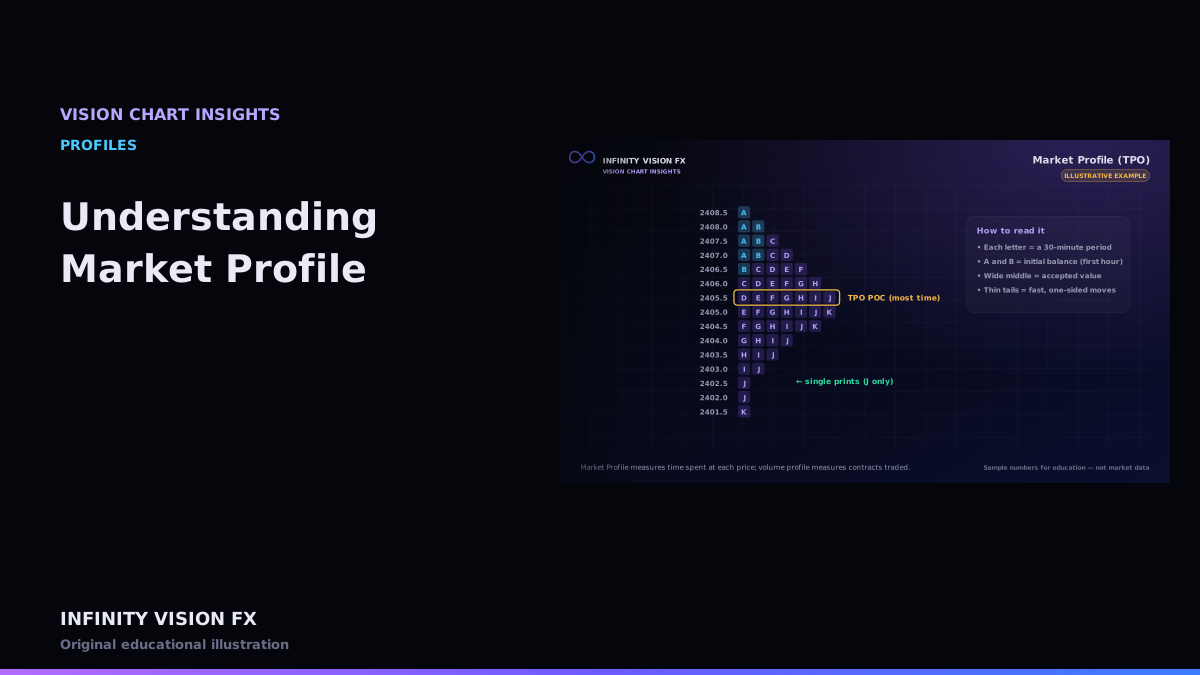
Market Profile organises a session by time spent at each price. It was developed to describe how an auction searches for value, and it remains one of the clearest ways to see a session's shape.
TPOs: time price opportunities
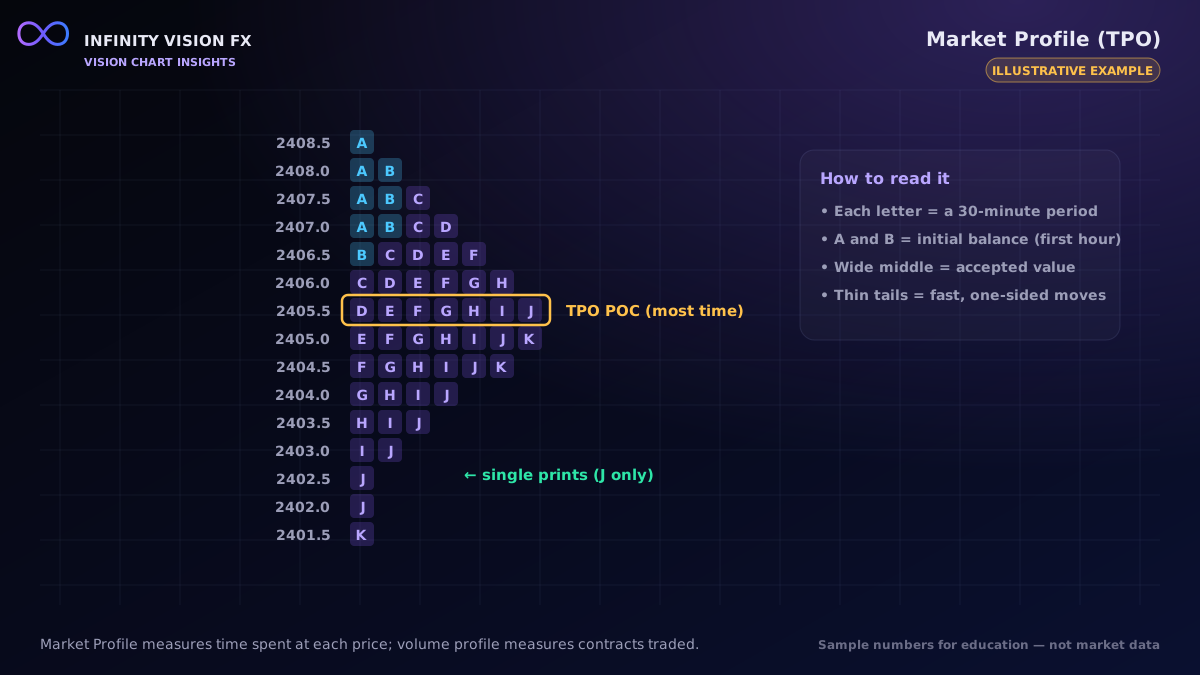
The session is split into periods — usually 30 minutes. Each period gets a letter (A, B, C …). For every price a period traded at, its letter is printed in that row. A row with many letters is a price where the market spent a lot of time.
Key features
- Initial balance (IB) — the range of the first hour (periods A and B by default). How far the day extends beyond it describes whether the session stayed balanced or trended.
- TPO POC — the price with the most letters (the most time).
- Value area — the range holding about 70 % of all TPOs, built outward from the TPO POC.
- Single prints — prices touched by only one period inside the profile; they mark fast, one-directional movement.
- Poor high / poor low — an extreme with two or more TPOs, suggesting the auction stopped there without a sharp rejection. Many traders treat it as "unfinished" business; it is an observation, not a forecast.
Balance vs range extension
VISION CHART reports the ratio of the session range to the initial-balance range:
- Close to 1 → balanced session; the market stayed near its opening range.
- 2 or more → range extension; price moved well beyond the first hour.
Market Profile vs volume profile
| Market Profile | Volume Profile | |
|---|---|---|
| Measures | time at price | contracts traded at price |
| Built from | price ranges per period | executed trades |
| Needs volume data | no | yes |
They often agree, but when the TPO POC and the volume POC differ, the market spent time at one price while most contracts traded at another — useful context.
A worked example (illustrative)
A session's first hour (periods A and B) trades between 2398.0 and 2402.0: an initial balance of 4.0. By the close the day's range is 2396.5–2409.0 (12.5). The range is about 3.1× the initial balance — a range-extension day. Most letters cluster between 2405 and 2408, where the market spent the afternoon: value migrated higher during the session.
Building TPOs from bars
VISION CHART builds TPOs from bar ranges: every price a 30-minute period touched gets that period's letter. With row sizes of several ticks, a row gets a letter if the period traded anywhere inside it. Larger rows make the profile easier to read in volatile sessions.
Limitations
TPOs ignore how much traded at each price, only how long. In fast news-driven moves, a price can see heavy volume in a single period and still show only one letter.
Key takeaways
- TPOs record time at price, one letter per period.
- Initial balance, single prints and poor extremes describe the session's auction.
- Keep Market Profile and volume profile separate; they answer different questions.
Next article: What Is Absorption?
Educational content only, not financial advice. Examples and illustrations use sample numbers and are not observations of real market activity. Order flow describes past and present activity; it does not predict prices.