Understanding Footprint Charts
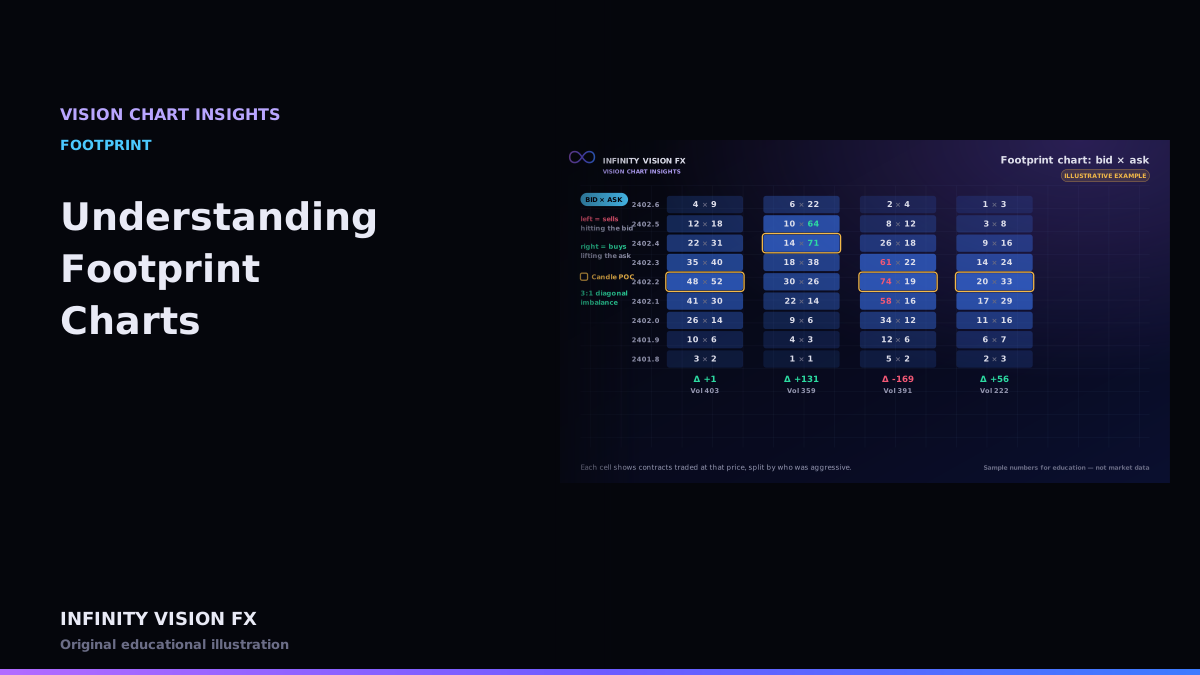
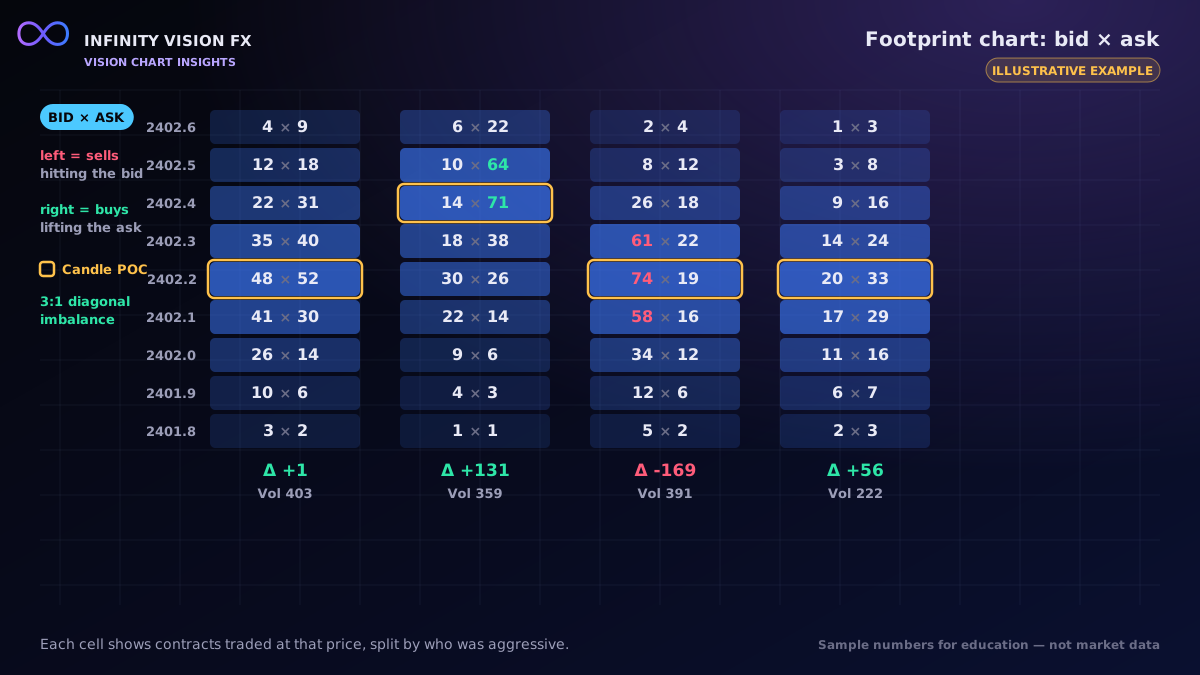
A footprint chart opens up each candle. Instead of one body and two wicks, you see a column of prices, and at each price, the volume that traded there — split into contracts that hit the bid and contracts that lifted the ask.
Anatomy of a footprint cell
Each row in a footprint candle is one price level (or a group of levels when you aggregate ticks). The most common display is Bid × Ask:
- The left number is volume traded at the bid — aggressive sellers.
- The right number is volume traded at the ask — aggressive buyers.
Display modes
VISION CHART supports several views of the same data:
| Mode | What each cell shows |
|---|---|
| Bid × Ask | sell aggressor volume × buy aggressor volume |
| Delta | ask volume − bid volume at that price |
| Volume | total contracts at that price |
| Bid/Ask ratio | ask ÷ bid at that price |
| Imbalance | highlights cells that beat the diagonal ratio threshold |
Summary rows
Under each candle you usually see:
- Volume — all contracts traded in the candle.
- Delta — total ask volume minus total bid volume.
- Delta % — delta divided by volume, which makes candles of different size comparable.
The candle point of control
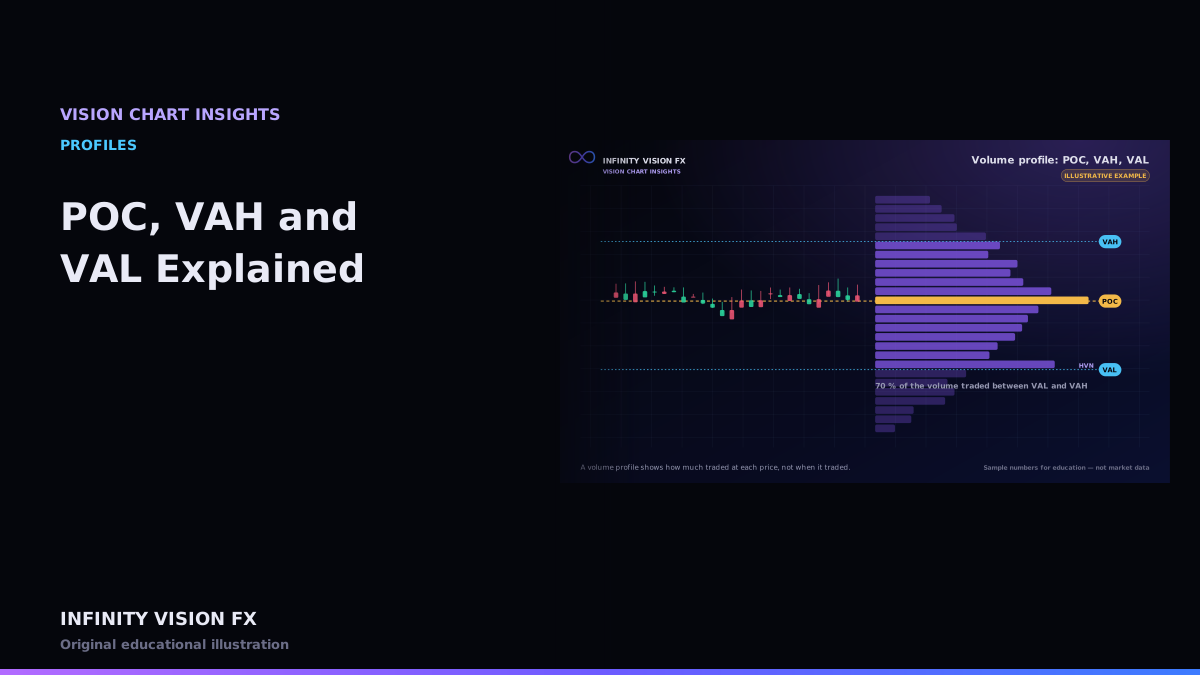
The price with the most volume inside a candle is its point of control (POC). A POC near the high of an up candle means much of the trading happened at the top of the range; a POC near the low tells a different story. Neither is a signal on its own.
Interactive example: open this article on the Infinity Vision FX website to use it.
Settings that change what you see
- Tick aggregation — grouping 2, 5 or 10 ticks per row makes busy markets readable but hides detail.
- Timeframe — a 1-minute footprint and a 15-minute footprint of the same move look very different.
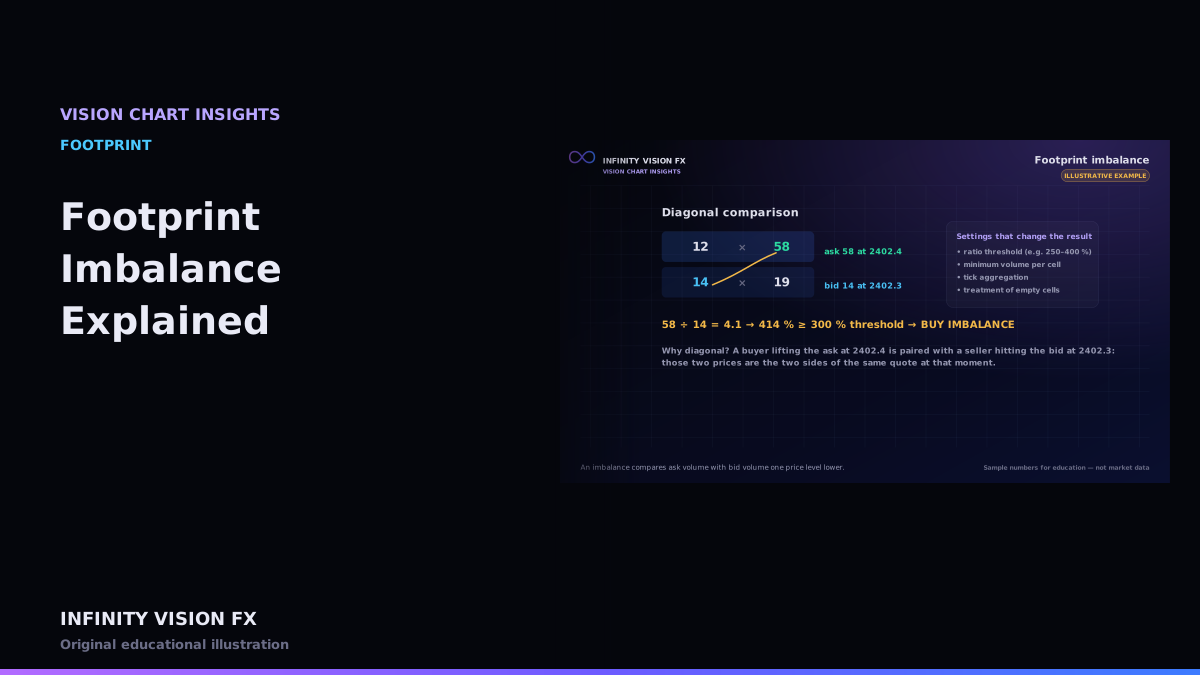
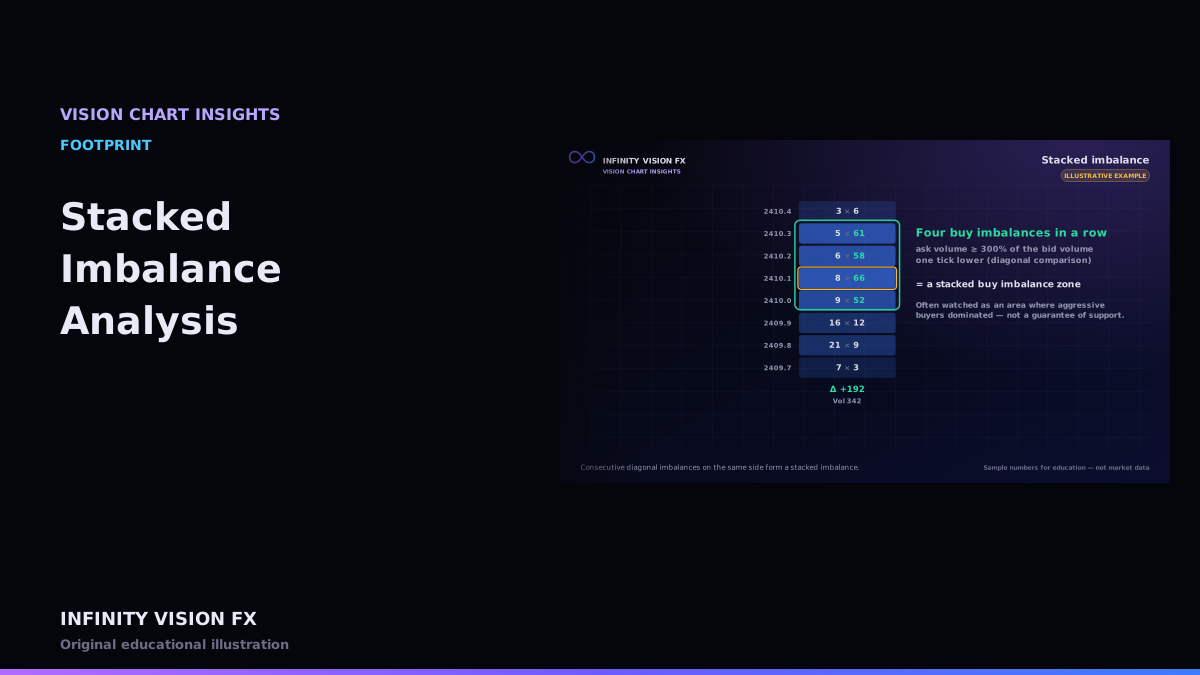
- Imbalance threshold — commonly 250–400 %; see Footprint Imbalance Explained.
Data requirements
Footprints are built from executed trades with aggressor side. When a data feed does not report the side, software must estimate it (for example by comparing the trade price with the bid and ask at that moment). VISION CHART marks estimated sides as estimated.
Common misreadings
- Treating one large number as a signal without context.
- Ignoring that a slow session produces small numbers everywhere.
- Comparing footprints built with different aggregation settings.
Key takeaways
- A footprint splits volume by price and by aggressor side.
- The candle POC marks where most contracts traded inside the bar.
- Settings (aggregation, timeframe, thresholds) strongly shape the picture.
- Footprints require real trade data with aggressor side.
Next article: Bid Volume vs Ask Volume
Educational content only, not financial advice. Examples and illustrations use sample numbers and are not observations of real market activity. Order flow describes past and present activity; it does not predict prices.