Introduction to Order Flow Trading
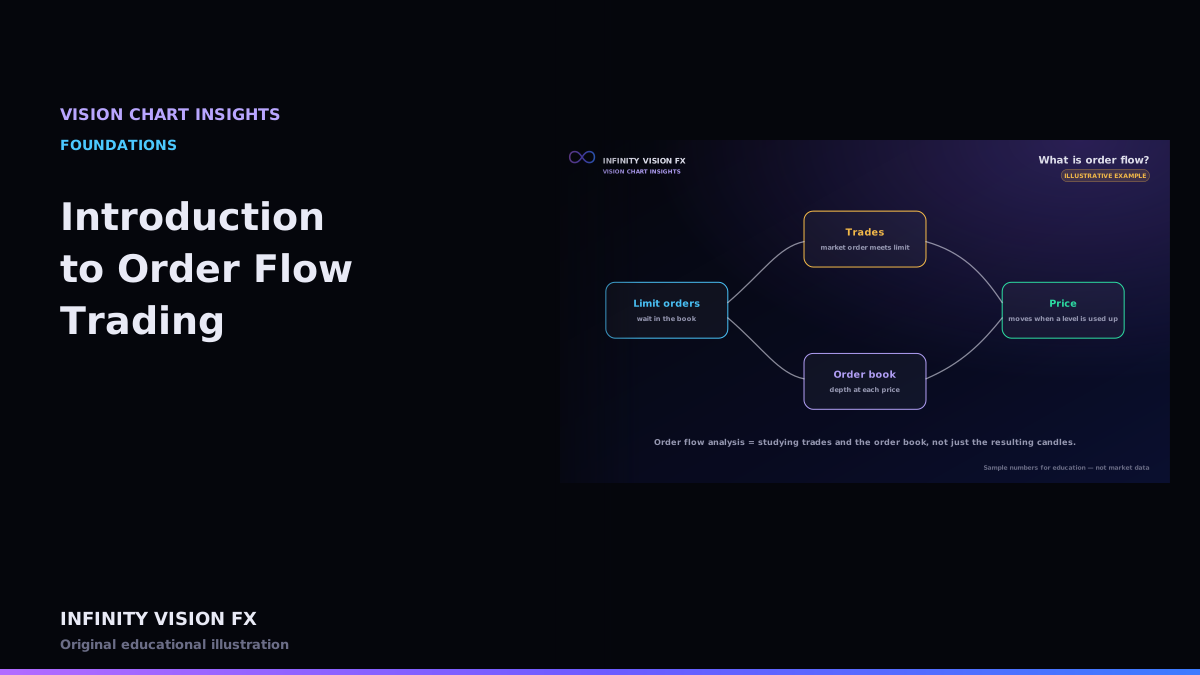
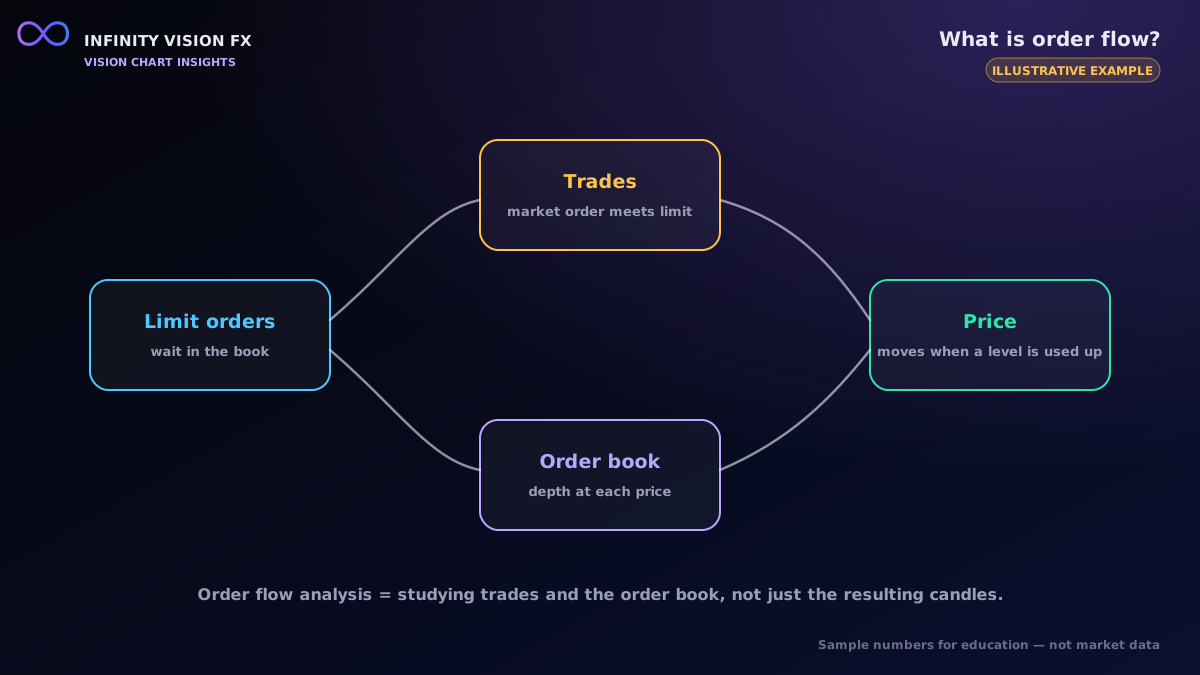
Most charts show the result of trading: a candle with an open, high, low and close. Order flow analysis looks one level deeper, at the trades and orders that produced that candle. Instead of asking only "where did price go?", it asks "how much traded at each price, who was in a hurry, and what was waiting in the order book?".
This article explains the core idea in plain language and sets out what the rest of VISION CHART INSIGHTS builds on.
Two kinds of orders meet
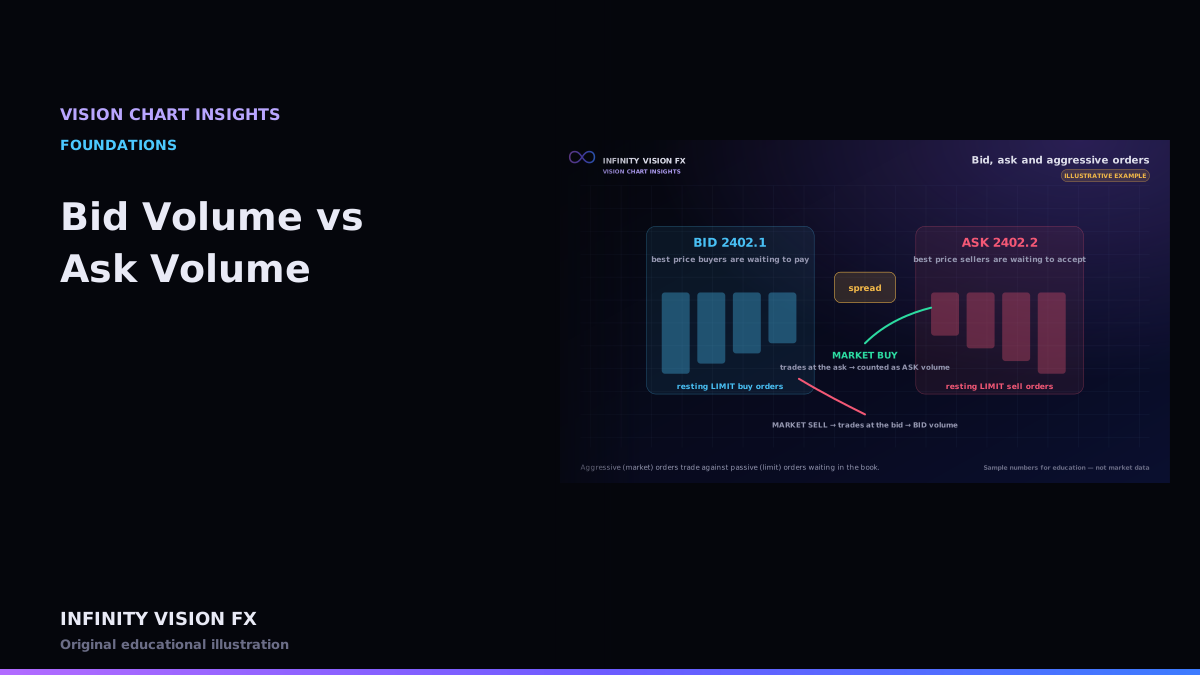
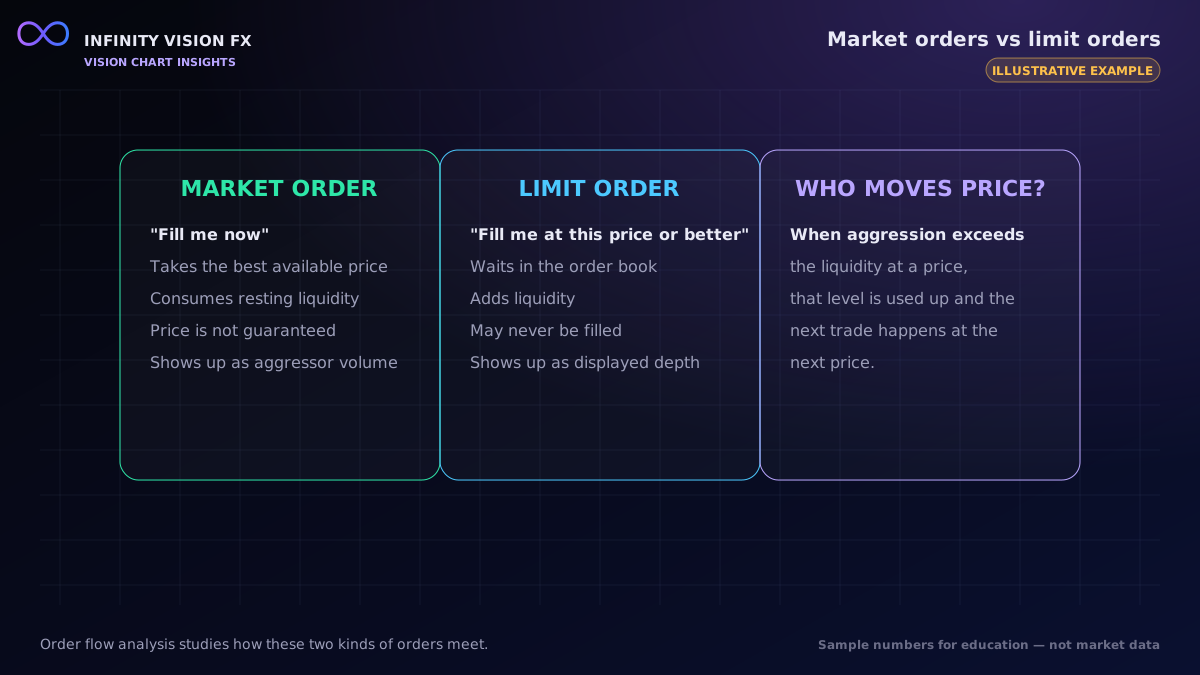
Every trade needs two sides. In an exchange market such as COMEX gold futures, one side is usually a limit order that was already waiting in the order book, and the other is a market order (or a marketable limit order) that arrived and accepted that price.
- Limit orders say "buy (or sell) at this price or better". They wait and add liquidity.
- Market orders say "fill me now". They take liquidity at the best available price.
The trader who sends the market order is called the aggressor. When an aggressive buyer trades against a resting sell order, the trade happens at the ask. When an aggressive seller trades against a resting buy order, the trade happens at the bid.
Why that matters
Price only moves to a new level when the orders resting at the current level are used up (or cancelled). Order flow tools try to show that process:
- Footprint charts split each candle's volume by price and by aggressor side.
- Delta and cumulative delta (CVD) measure whether aggressive buying or selling dominated.
- Volume profile shows where the most contracts changed hands.
- Depth of Market (DOM) and liquidity heatmaps show resting limit orders and how they change.
What data is required
Order flow is a data-hungry discipline. A candle chart needs four prices per bar. Order flow needs:
- Every trade (time, price, size), ideally with the aggressor side reported by the exchange feed.
- The order book (Level 2 depth): the size waiting at each price, updated as it changes.
- For some studies, Market-by-Order data that tracks individual orders.
Why gold futures, not spot gold
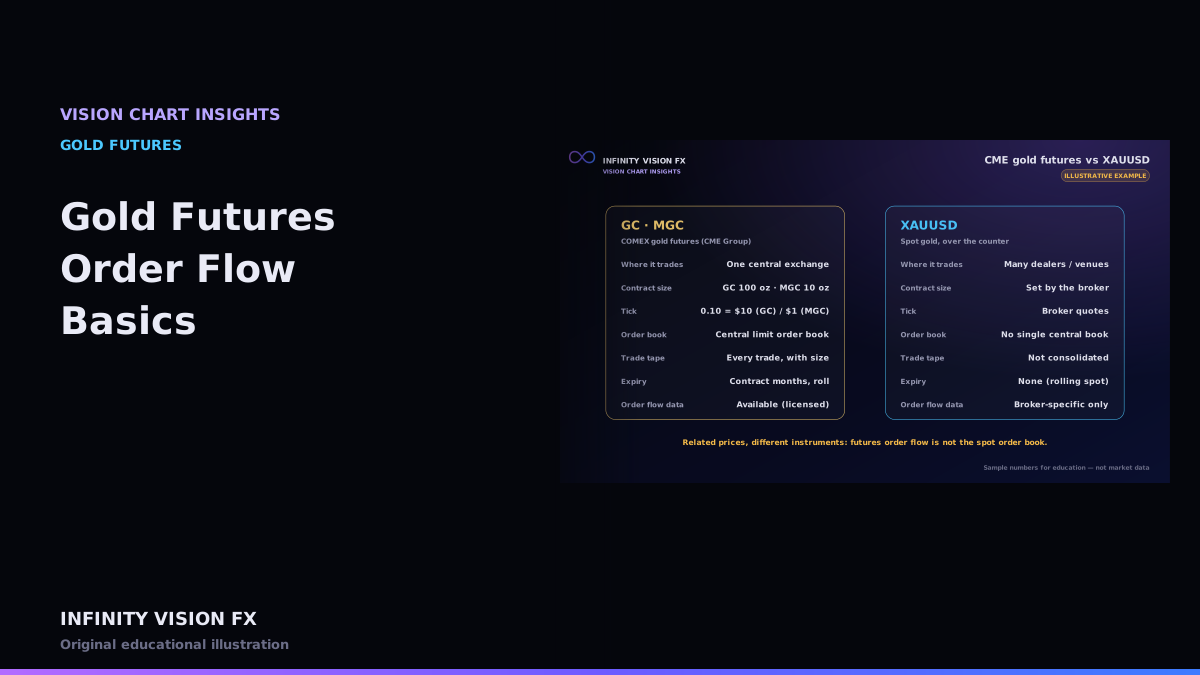
COMEX gold futures (GC, and the smaller MGC) trade on one central exchange with a single order book and a complete trade record. Spot gold (XAUUSD) trades over the counter across many dealers, so there is no single order book or consolidated tape to analyse. That is why VISION CHART focuses on CME gold futures. See CME Gold Futures vs XAUUSD.
What order flow can and cannot do
Order flow describes behaviour: where volume traded, which side was aggressive, how resting orders changed. It does not reveal who traded, why they traded or what will happen next. Displayed limit orders can be cancelled in milliseconds, and many large participants split orders to hide their size.
Key takeaways
- Order flow analyses trades and the order book, not just candles.
- The aggressor is the side that crossed the spread; its volume is counted at the bid or the ask.
- Real order flow needs trade-by-trade and depth data from an exchange.
- Gold order flow is studied on COMEX futures because spot gold has no central order book.
Next article: Understanding Footprint Charts
Educational content only, not financial advice. Examples and illustrations use sample numbers and are not observations of real market activity. Order flow describes past and present activity; it does not predict prices.